

 Bitcoin
  Ethereum
  Tether
  BNB
BNB  USDC
USDC  XRP
XRP  Solana
  TRON
TRON  Figure Heloc
  Hyperliquid
  Dogecoin
  USDS
USDS  LEO Token
  Wrapped stETH
  Zcash
Zcash  Stellar
  Wrapped Bitcoin
  WhiteBIT Coin
  Binance Bridged USDT (BNB Smart Chain)
  Cardano
  Canton
  Wrapped eETH
  USD1
USD1  sUSDS
sUSDS  Bitcoin Cash
  Ethena USDe
  Coinbase Wrapped BTC
  Litecoin
  LAB
LAB  Hedera
  WETH
WETH  Circle USYC
  Sui
Sui  Global Dollar
  USDT0
USDT0  Avalanche
  Shiba Inu
  NEAR Protocol
  BlackRock USD Institutional Digital Liquidity Fund
  Ethena Staked USDe
  Ondo US Dollar Yield
  MemeCore
  Bittensor
  PAX Gold
  World Liberty Financial
  Aster
Aster  OKB
OKB  Ondo
Ondo  Ripple USD
  HTX DAO
  syrupUSDC
  Worldcoin
  Polkadot
  Falcon USD
  USDD
USDD  Sky
Sky  Aave
Aave  BFUSD
BFUSD  Pi Network
  Pepe
Pepe  Jupiter Perpetuals Liquidity Provider Token
  Spiko EU T-Bills Money Market Fund
  Quant
Quant  KuCoin
  Jito Staked SOL
  Audiera
  USDGO
USDGO  Janus Henderson Anemoy Treasury Fund
  Binance-Peg WETH
  Rocket Pool ETH
  Stable
  Cosmos Hub
  Binance Bridged USDC (BNB Smart Chain)
  Render
  Algorand
  POL (ex-MATIC)
  Function FBTC
  Jupiter
  JUST
JUST  NEXO
NEXO  USDtb
USDtb  ADI
ADI  syrupUSDT
  Ethena
  Gate
Gate  Beldex
  Binance Staked SOL
  币安人生 (BinanceLife)
  Spiko Amundi Overnight Swap Fund (EUR)
  Janus Henderson Anemoy AAA CLO Fund
  Filecoin
  Pump.fun
  Flare
Flare  NEW X CEO IS BACK
  Polygon Bridged USDC (Polygon PoS)
  Solv Protocol BTC
  Venice Token
  Usual USD
  Lighter
  clBTC
clBTC  YLDS
YLDS  Aerodrome Finance
  Midnight
  Aptos
Aptos  Arbitrum
  StakeWise Staked ETH
  TrueUSD
  Kinetiq Staked HYPE
  A7A5
A7A5  tBTC
tBTC  Injective
  EURC
EURC  Bonk
Bonk  Pudgy Penguins
  Official Trump
  c8ntinuum
  Artificial Superintelligence Alliance
  Mantle Staked Ether
  Ondo Short-Term U.S. Government Bond Fund
  VeChain
  Polygon PoS Bridged DAI (Polygon POS)
  Hastra PRIME
  SPX6900
  COCA
COCA  Virtuals Protocol
  Ether.fi
  Celestia
  Liquid Staked ETH
  Grass
Grass  Arbitrum Bridged WBTC (Arbitrum One)
  Jito
Jito  Terra Luna Classic
  The9bit
  Wrapped Flare
  Sun Token
  apxUSD
  L2 Standard Bridged WETH (Base)
  Kinesis Gold
  Steakhouse USDC Morpho Vault
  Curve DAO
  ETHGas
  Pyth Network
  Bitcoin SV
  Binance-Peg XRP
  Plasma
  Ether.Fi Liquid ETH
  Noon
Noon  AINFT
AINFT  Velvet
  Jupiter Staked SOL
  Olympus
  Savings USDD
  Unibase
  Monad
Monad  Marinade Staked SOL
  MegaUSD
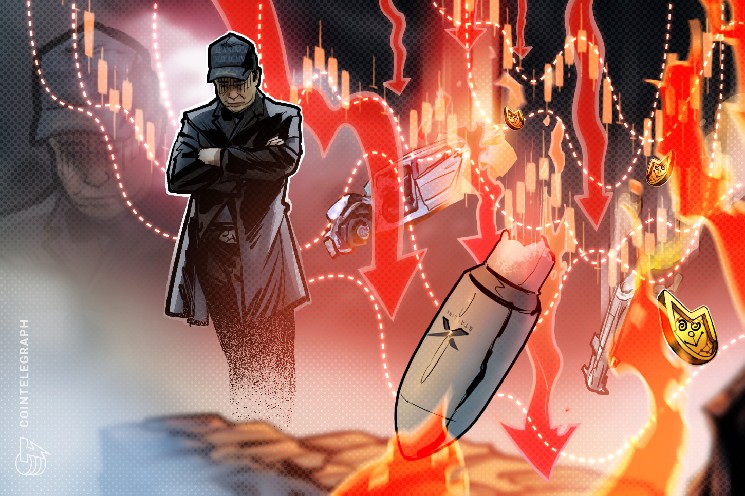
Bitcoin ($BTC) has dropped over 8% from its June high near $67,255, putting the $60,000 support level back in focus.
$BTC/USD daily chart. Source: TradingView
Key takeaways:
- The SpaceX-led tech market rout is pushing Bitcoin price toward the $60,000 support.
- A decisive breakdown below $60,000 may lead the price toward $56,000 or under.
SpaceX Rout Adds Pressure To Bitcoin’s $60K Support
Bitcoin is getting close to retesting $60,000 as SpaceX’s post-IPO rout erases over $600 billion in market value and shakes risk appetite across speculative assets.
The Elon Musk-led company priced its record IPO at $135 per share earlier in June, raising $75 billion at an implied valuation of about $1.77 trillion, based on 13.08 billion shares outstanding.
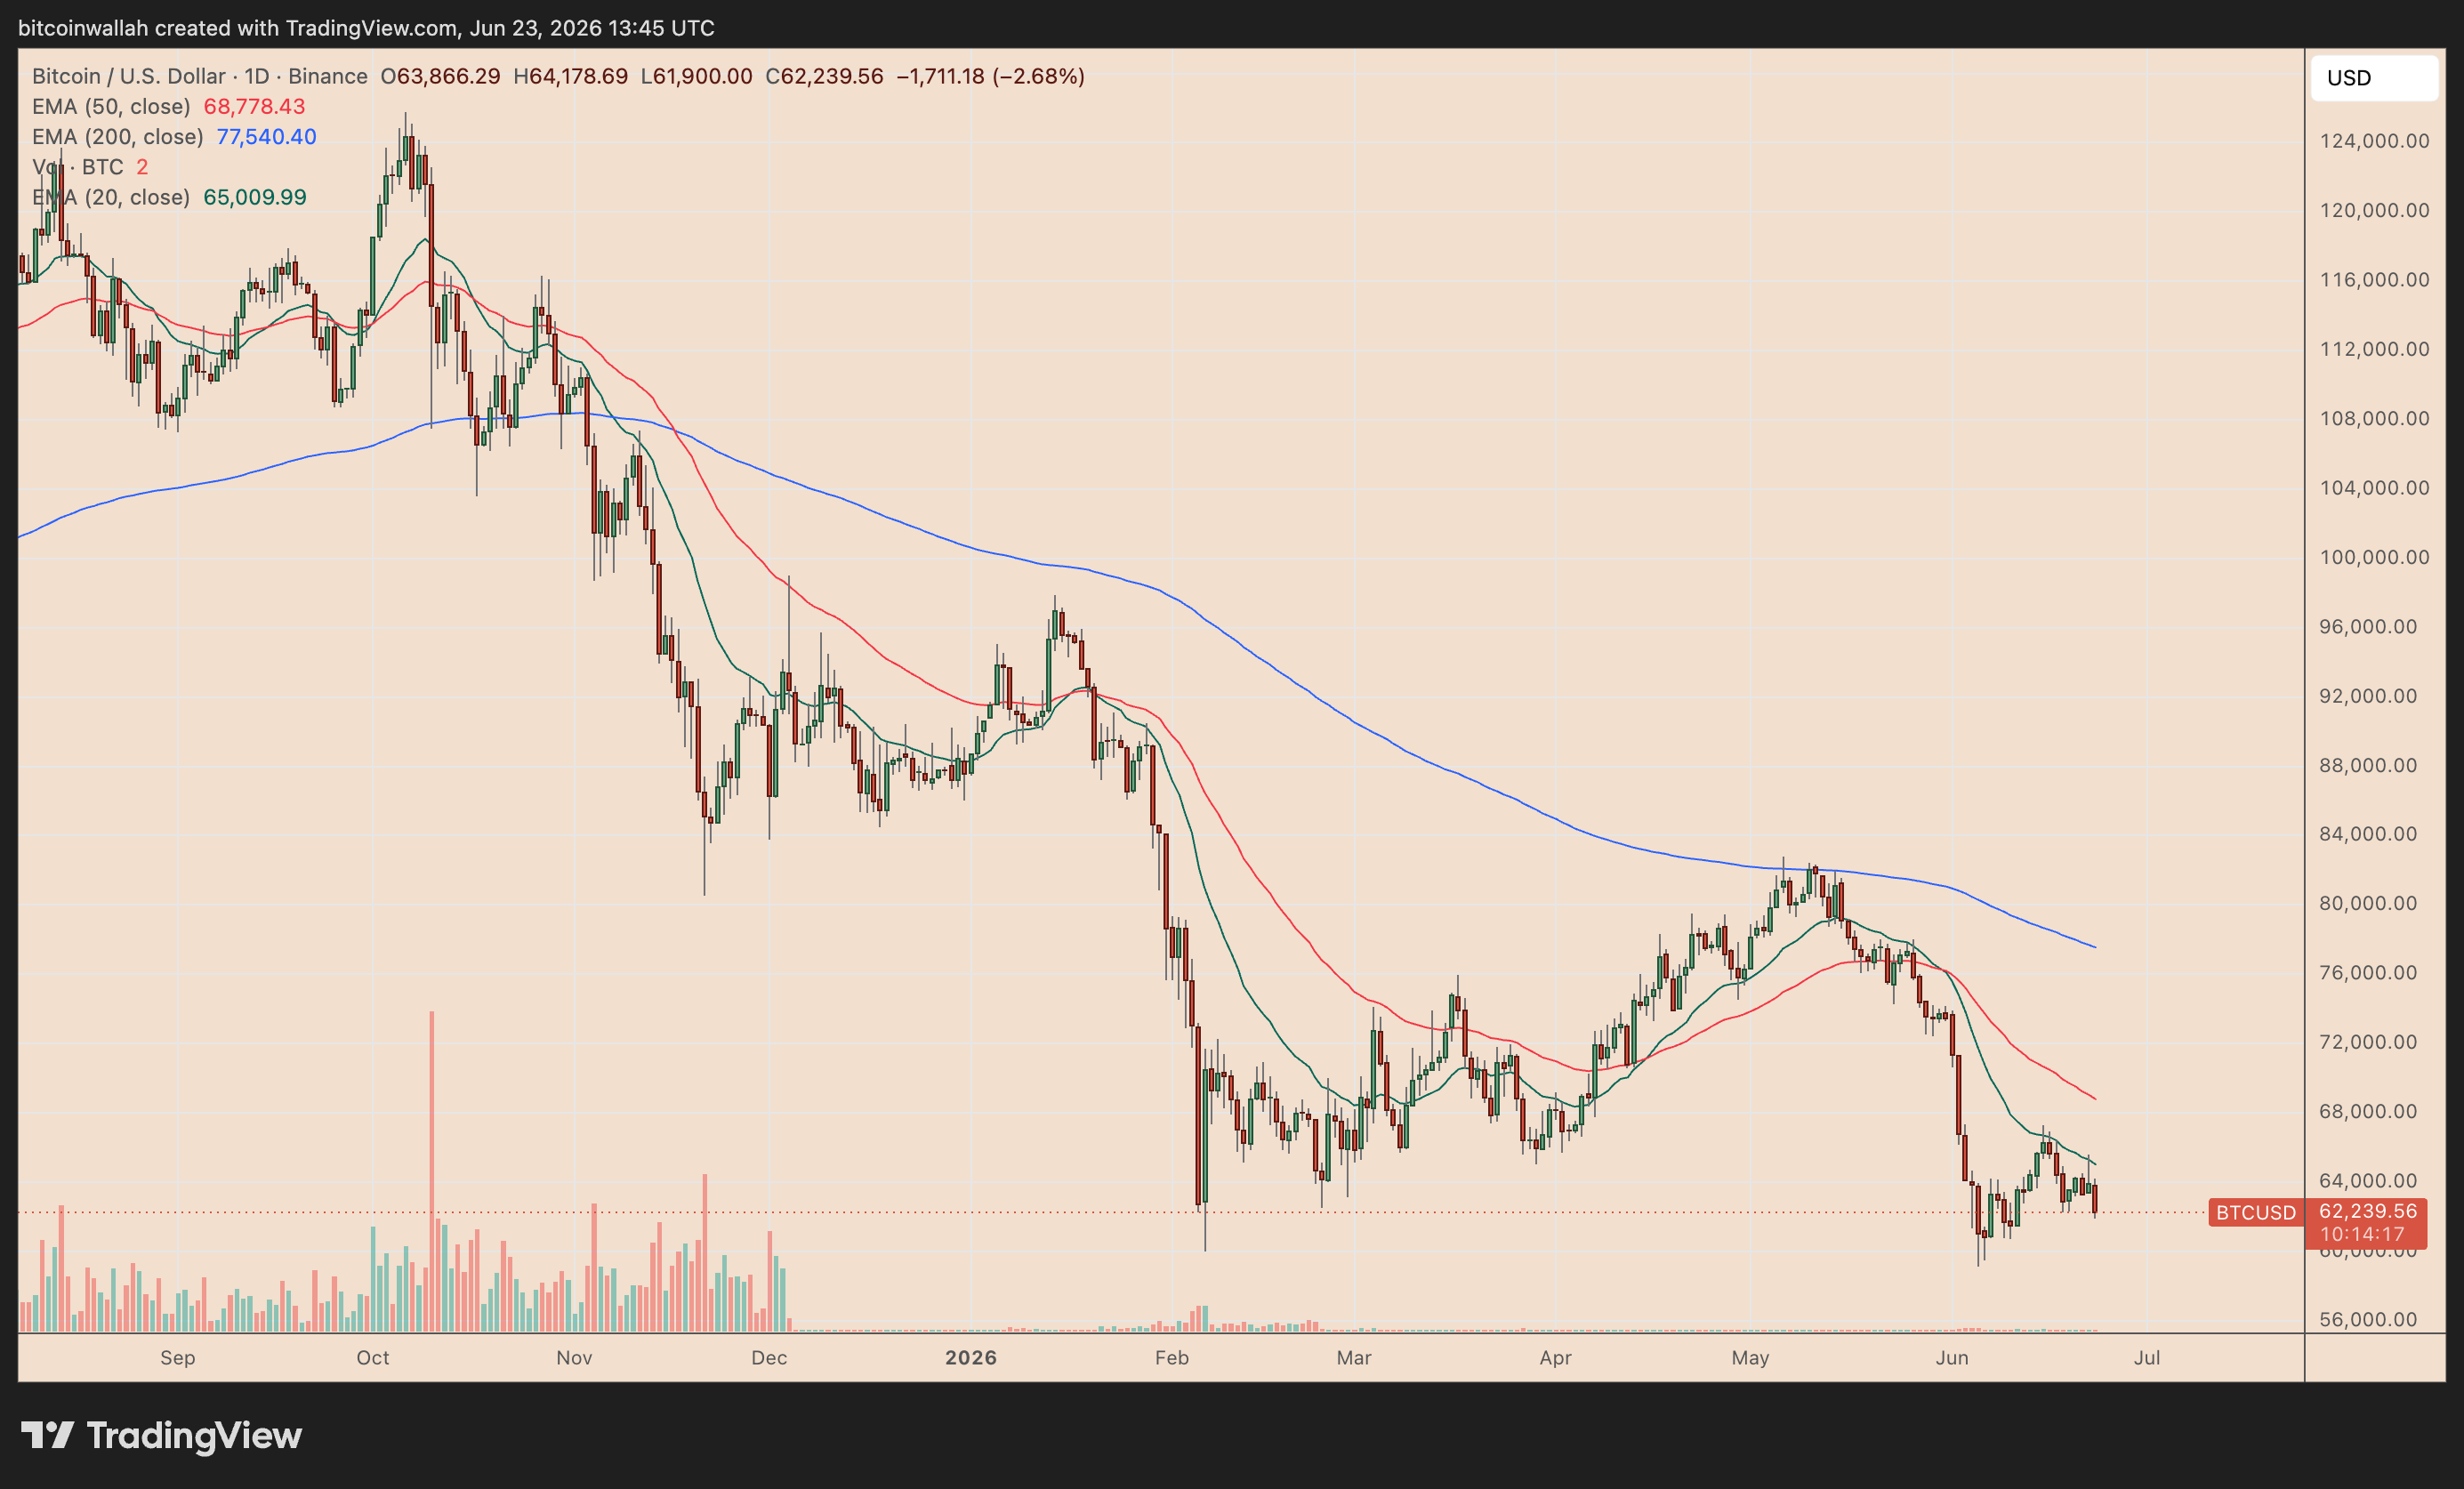
Investor demand was strong after the listing. SpaceX shares opened near $150 and later climbed to a post-IPO peak of $211.39 on June 16, pushing its implied market capitalization to nearly $2.8 trillion.
SPCX hourly performance chart. Source: TradingView
Shares have dropped roughly 27% from their peak, pulling the stock back toward $150 and erasing much of the debut rally.
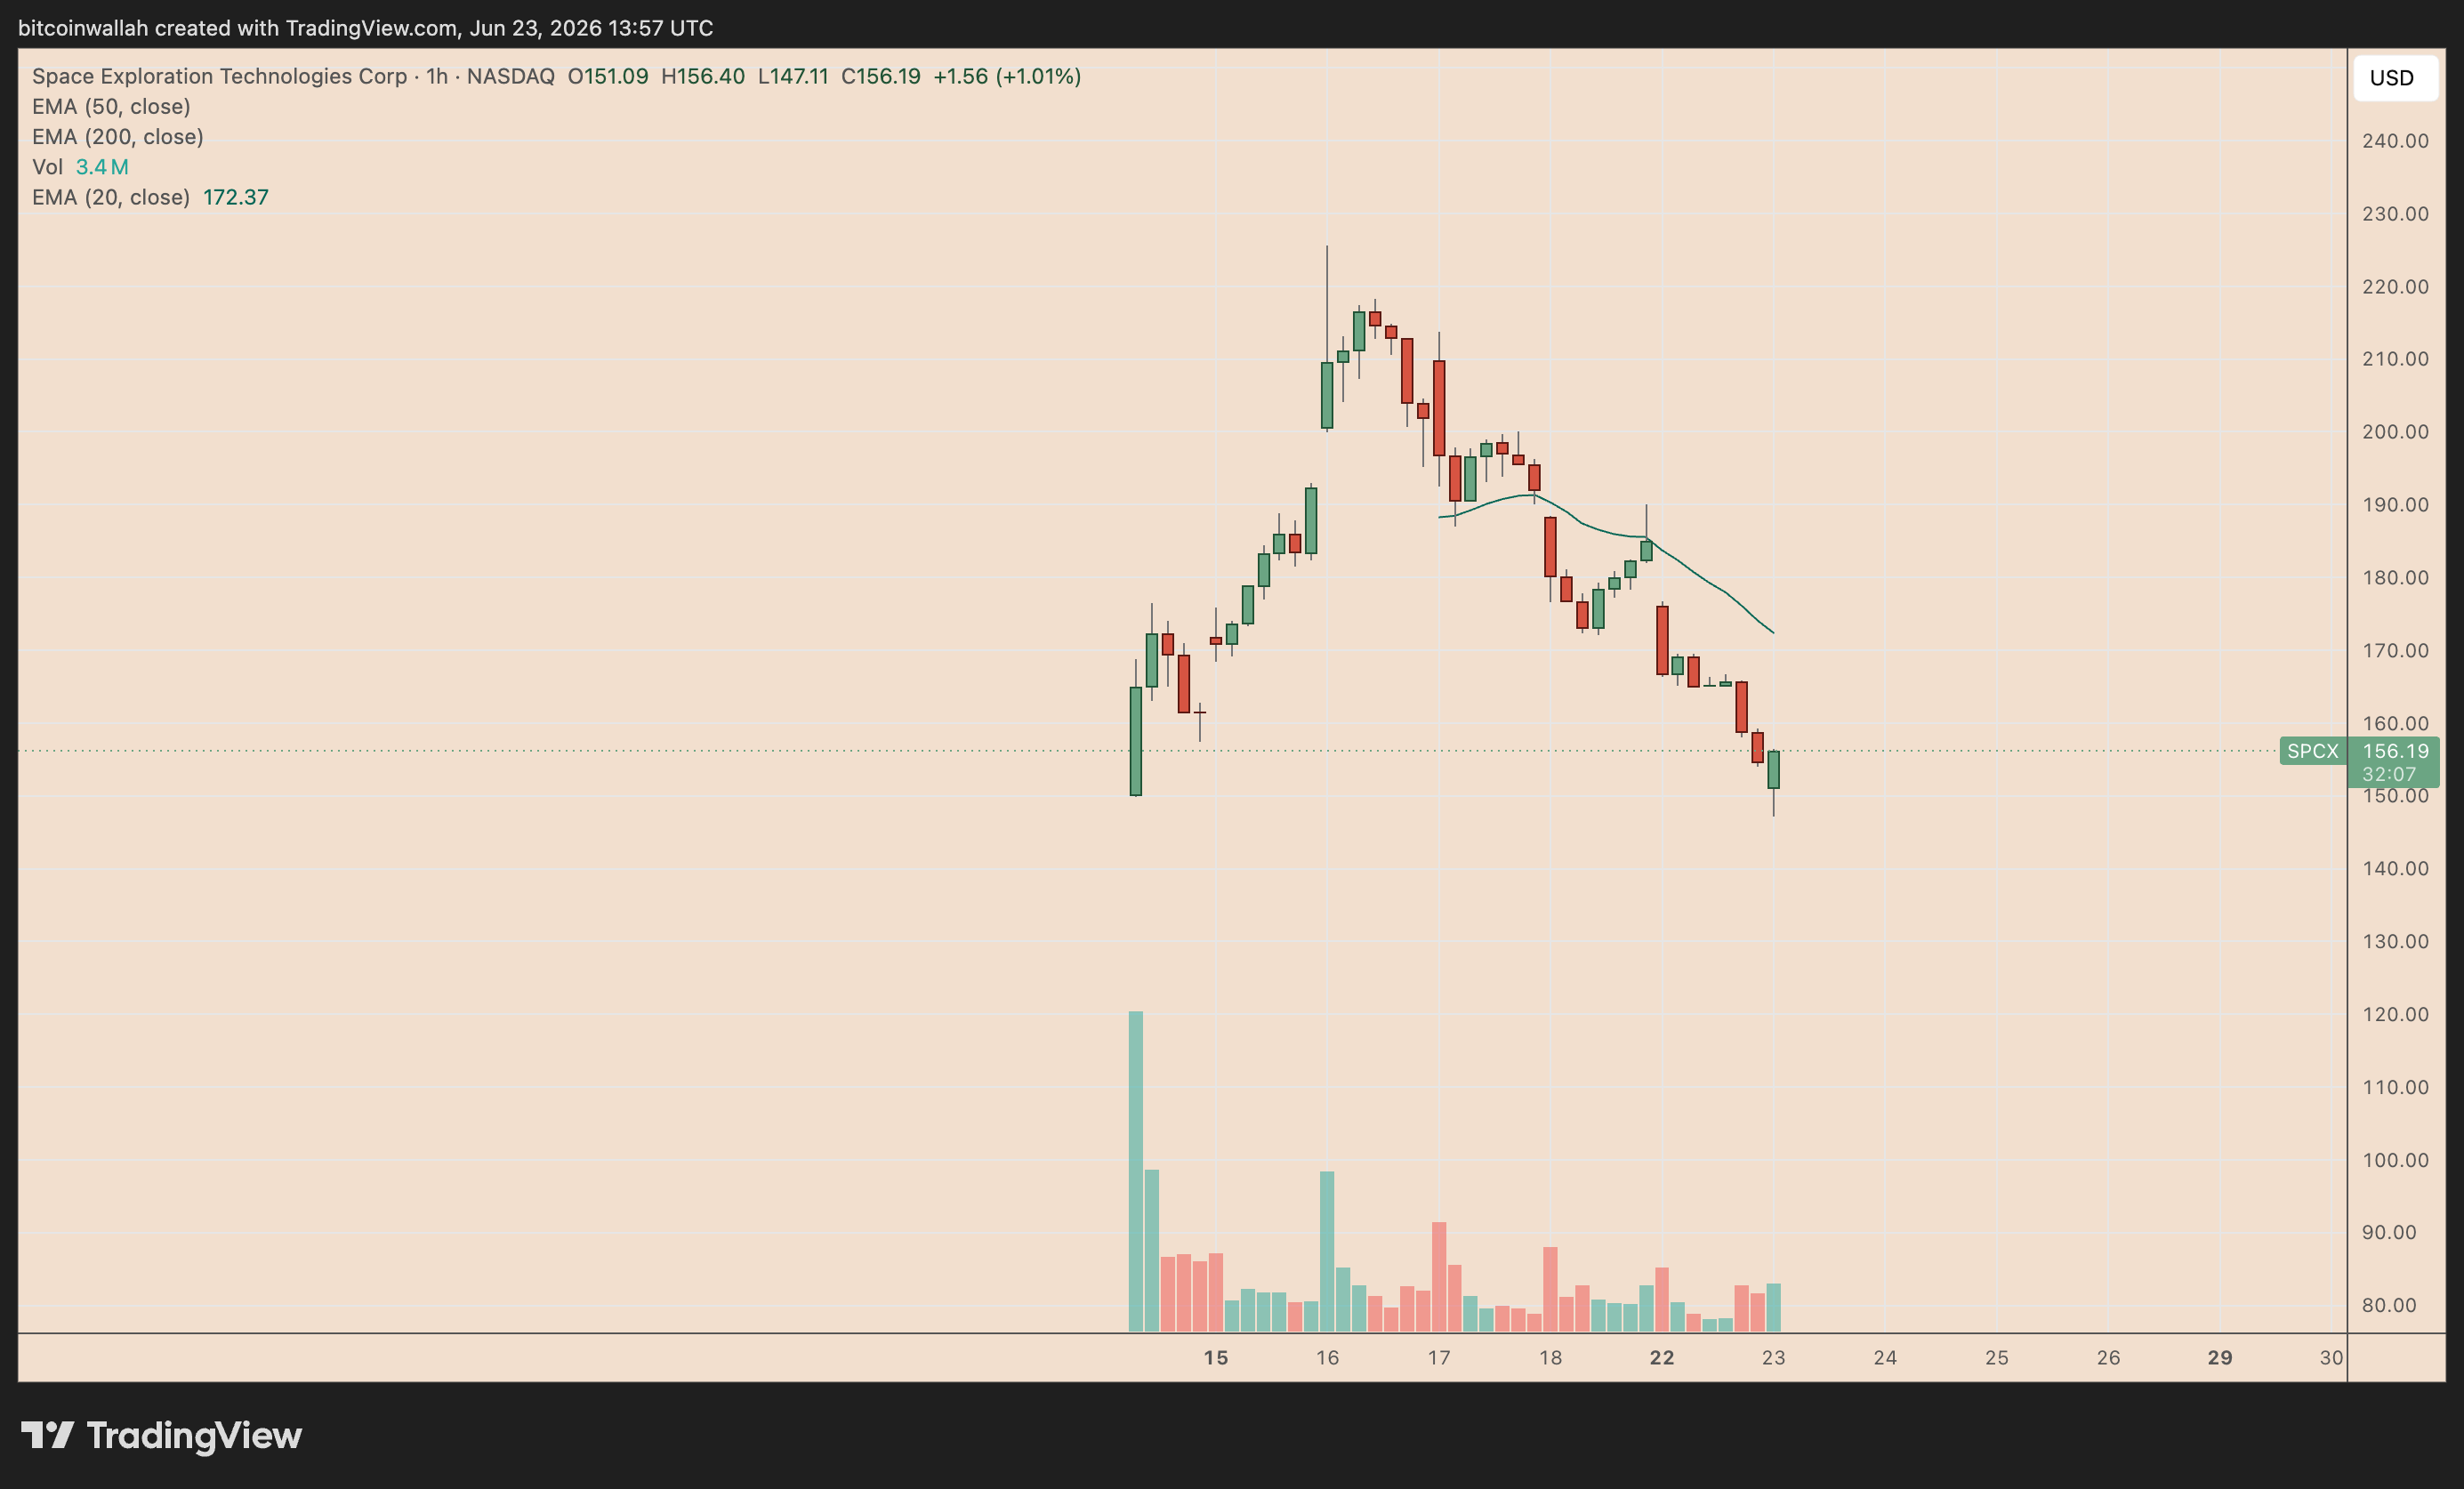
The SpaceX rout is part of a wider tech sell-off. Nasdaq 100 futures fell more than 3% on Tuesday, putting the index on track to erase over $1 trillion in market value. Chip stocks also dropped sharply, with Intel, AMD, Micron and SanDisk leading the decline.
Nasdaq 100 daily performance chart. Source: TradingView
Bitcoin typically trades like a liquidity-sensitive risk asset during market stress. When investors cut exposure to expensive tech and speculative growth names, crypto usually faces similar selling pressure.
In a Tuesday post, analyst Nehal said there’s a high probability of Bitcoin falling under $60,000 if it breaks below $62,200, adding:
“For now, it’s still a range game. Real breakout signals come above $65.7K or below $59K.”
Bitcoin head-and-shoulders pattern sets $56,000 target
Bitcoin’s four-hour chart shows a potential head-and-shoulders pattern, adding technical pressure to the ongoing sell-off.
The left shoulder formed near $64,500, followed by a higher peak near $67,000 that created the head. $BTC then failed to reclaim that high, forming a lower right shoulder near $65,000 before turning lower again.
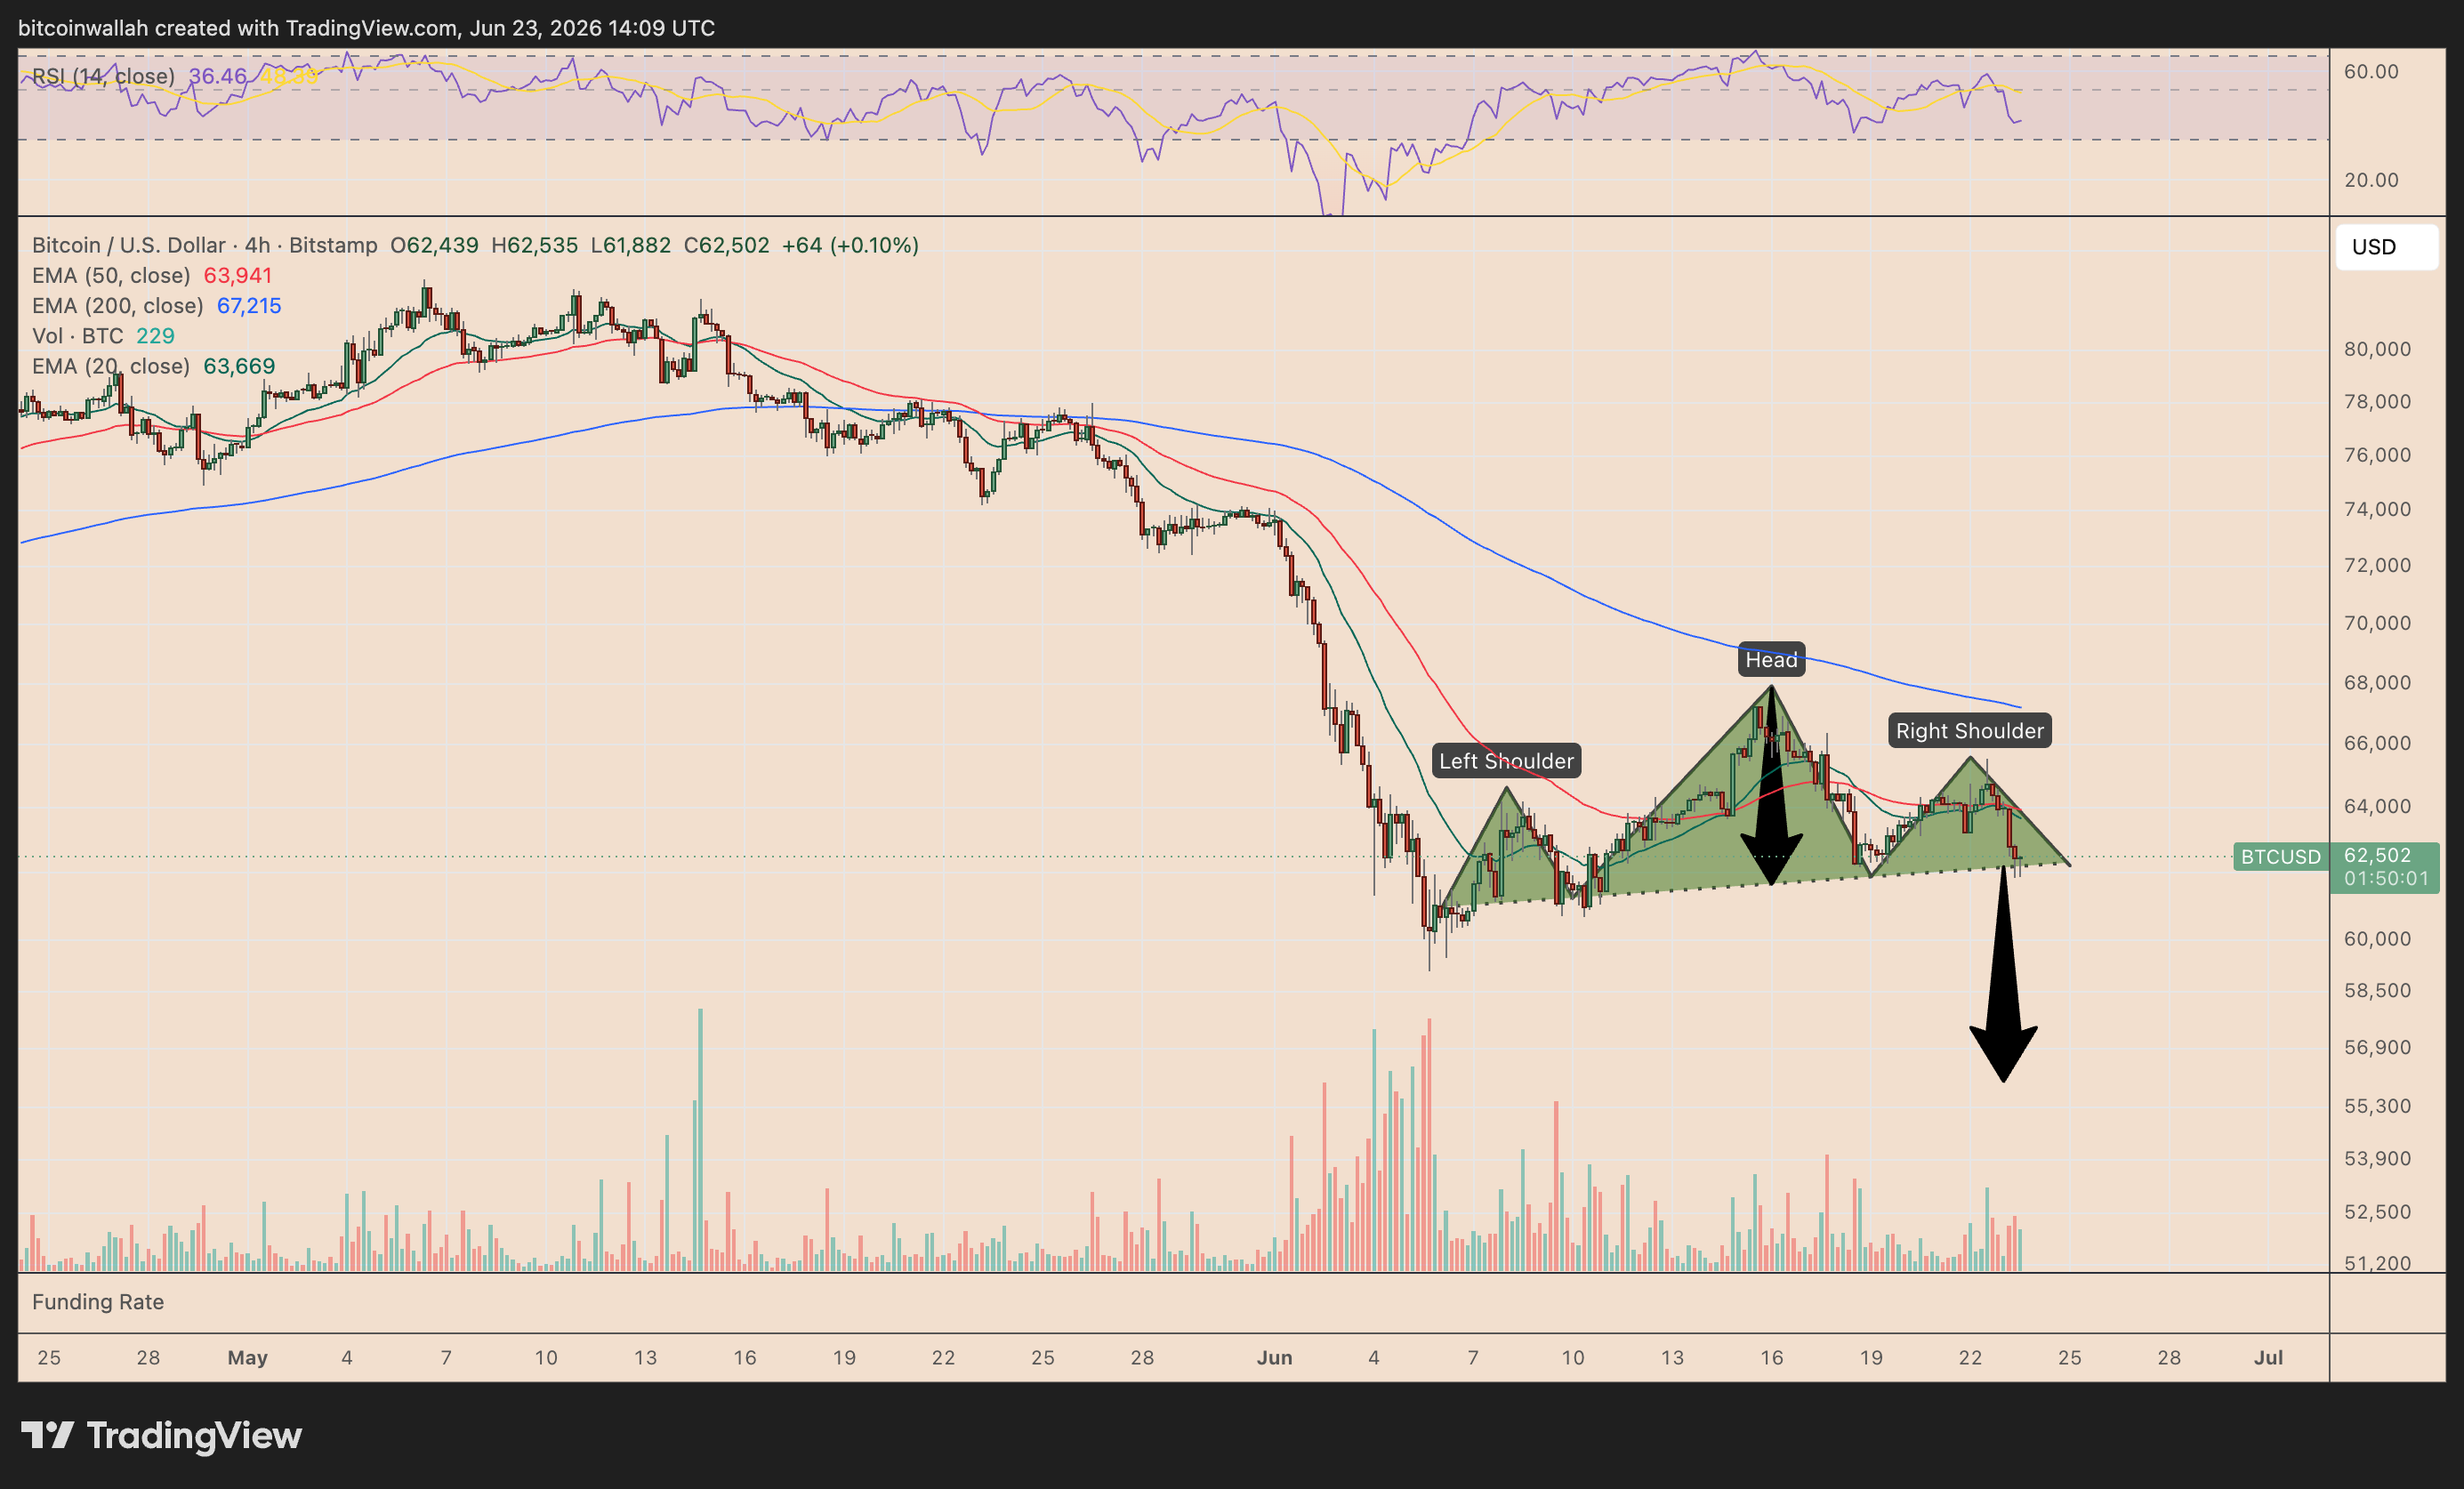
$BTC/USD four-hour chart. Source: TradingView
The pattern’s neckline sits around the $61,000–$62,000 area, close to Bitcoin’s current support zone. A decisive four-hour close below that range would confirm the bearish setup and increase the risk of a deeper decline.
The measured downside target sits near $55,000–$56,000, based on the distance between the head and the neckline. Multiple $BTC analyses in the past have presented similar downside price targets.
Nevertheless, $BTC’s bullish structure remains active as long as it holds above $60,000, with the possibility of returning above $81,000 over the next few months.