

 Bitcoin
  Ethereum
  Tether
  BNB
BNB  USDC
USDC  XRP
XRP  Solana
  TRON
TRON  Figure Heloc
  Hyperliquid
  Dogecoin
  USDS
USDS  LEO Token
  Wrapped stETH
  Zcash
Zcash  Stellar
  Wrapped Bitcoin
  WhiteBIT Coin
  Binance Bridged USDT (BNB Smart Chain)
  Canton
  Cardano
  Wrapped eETH
  LAB
LAB  USD1
USD1  Ethena USDe
  sUSDS
sUSDS  Coinbase Wrapped BTC
  Bitcoin Cash
  MemeCore
  Hedera
  WETH
WETH  Litecoin
  Circle USYC
  Sui
Sui  USDT0
USDT0  Global Dollar
  Shiba Inu
  NEAR Protocol
  Avalanche
  Ethena Staked USDe
  BlackRock USD Institutional Digital Liquidity Fund
  Bittensor
  Ondo US Dollar Yield
  Worldcoin
  PAX Gold
  World Liberty Financial
  Ondo
Ondo  Aster
Aster  Ripple USD
  Polkadot
  syrupUSDC
  HTX DAO
  OKB
OKB  Falcon USD
  Pi Network
  USDD
USDD  Sky
Sky  BFUSD
BFUSD  Pepe
Pepe  Aave
Aave  Jupiter Perpetuals Liquidity Provider Token
  Quant
Quant  KuCoin
  Spiko EU T-Bills Money Market Fund
  Jito Staked SOL
  Cosmos Hub
  USDtb
USDtb  Render
  Janus Henderson Anemoy Treasury Fund
  Binance-Peg WETH
  Algorand
  Rocket Pool ETH
  POL (ex-MATIC)
  Binance Bridged USDC (BNB Smart Chain)
  Ethena
  Stable
  NEXO
NEXO  Function FBTC
  币安人生 (BinanceLife)
  Gate
Gate  Janus Henderson Anemoy AAA CLO Fund
  Venice Token
  syrupUSDT
  JUST
JUST  Beldex
  Flare
Flare  Binance Staked SOL
  Jupiter
  Filecoin
  YLDS
YLDS  Audiera
  NEW X CEO IS BACK
  Polygon Bridged USDC (Polygon PoS)
  Spiko Amundi Overnight Swap Fund (EUR)
  Solv Protocol BTC
  Usual USD
  Arbitrum
  Midnight
  clBTC
clBTC  Aptos
Aptos  A7A5
A7A5  Injective
  ADI
ADI  TrueUSD
  StakeWise Staked ETH
  Ondo Short-Term U.S. Government Bond Fund
  Pump.fun
  Kinetiq Staked HYPE
  tBTC
tBTC  Official Trump
  Artificial Superintelligence Alliance
  EURC
EURC  Aerodrome Finance
  VeChain
  c8ntinuum
  Pudgy Penguins
  Mantle Staked Ether
  PRIME
PRIME  Bonk
Bonk  Polygon PoS Bridged DAI (Polygon POS)
  Virtuals Protocol
  Humanity
  COCA
COCA  Lighter
  Terra Luna Classic
  Liquid Staked ETH
  Arbitrum Bridged WBTC (Arbitrum One)
  Celestia
  Jito
Jito  The9bit
  SkyAI
SkyAI  Wrapped Flare
  apxUSD
  L2 Standard Bridged WETH (Base)
  Sun Token
  Steakhouse USDC Morpho Vault
  SPX6900
  Curve DAO
  Kinesis Gold
  Ether.fi
  Unibase
  Binance-Peg XRP
  Ether.Fi Liquid ETH
  USDGO
USDGO  Pyth Network
  AINFT
AINFT  Noon
Noon  Conflux
  FLOKI
FLOKI  Jupiter Staked SOL
  DoubleZero
  Savings USDD
  Zebec Network
  Kinesis Silver
  Marinade Staked SOL
  Monad
Monad  Arbitrum Bridged WETH (Arbitrum One)
Bitcoin has fallen to around $62,400 after a combination of options-expiry volatility, long liquidations, and renewed concerns over corporate Bitcoin selling weighed on sentiment across the crypto market.
- Bitcoin fell to around $62,400 as options expiry, long liquidations, and Strategy sale concerns weighed on sentiment.
- Nearly $136 million in BTC positions were liquidated, with long traders accounting for roughly $122 million of losses.
- Analysts are closely watching the $61K-$62K support zone, with a break below potentially exposing a move toward $59K.
According to data from crypto.news, Bitcoin (BTC) fell nearly 3% over the previous 24 hours to an intraday low near $62,300 on June 19. The decline extended losses after roughly $2.13 billion in Bitcoin and Ethereum options contracts expired.
Investors also digested reports that Strategy could potentially sell between $3 billion and $4 billion worth of Bitcoin to support its STRC preferred stock, which recently traded below its $100 par value.
Further, CoinGlass data showed nearly $136 million worth of Bitcoin positions were liquidated over the past 24 hours, with about $122 million coming from long positions. The concentration of bullish liquidations added selling pressure as leveraged traders were forced out of positions during the drop below $63,000.
Outside crypto, investors faced another restrictive macro backdrop. The market continued to assess the implications of Federal Reserve Chair Kevin Warsh’s first policy meeting, where policymakers reinforced expectations that interest rates could remain elevated for longer. The stronger U.S. dollar that followed added pressure to risk assets, including cryptocurrencies.
Energy markets offered little relief. Crude oil rebounded from roughly $75 to above $77 per barrel after planned U.S.-Iran talks in Switzerland were canceled and Israel continued strikes against Hezbollah targets in Lebanon. Even so, oil remained on track for a weekly decline as traders continued to price in improved shipping conditions through the Strait of Hormuz following the interim U.S.-Iran peace arrangement.
Another source of pressure emerged from the mining sector. Institutional analytics showed Bitcoin has spent five consecutive months below an estimated network production cost of approximately $78,000. The prolonged gap has reportedly forced some mining operators to liquidate holdings to cover operating expenses and debt obligations.
Bitcoin tests critical Fibonacci and moving-average support
Technical indicators show BTC trading at a key inflection point. On the four-hour chart, price has fallen to the 78.6% Fibonacci retracement level near $62,410, measured from the June low around $59,176 to the recent recovery high near $74,288. A break below that level would leave the June bottom as the next major support zone.
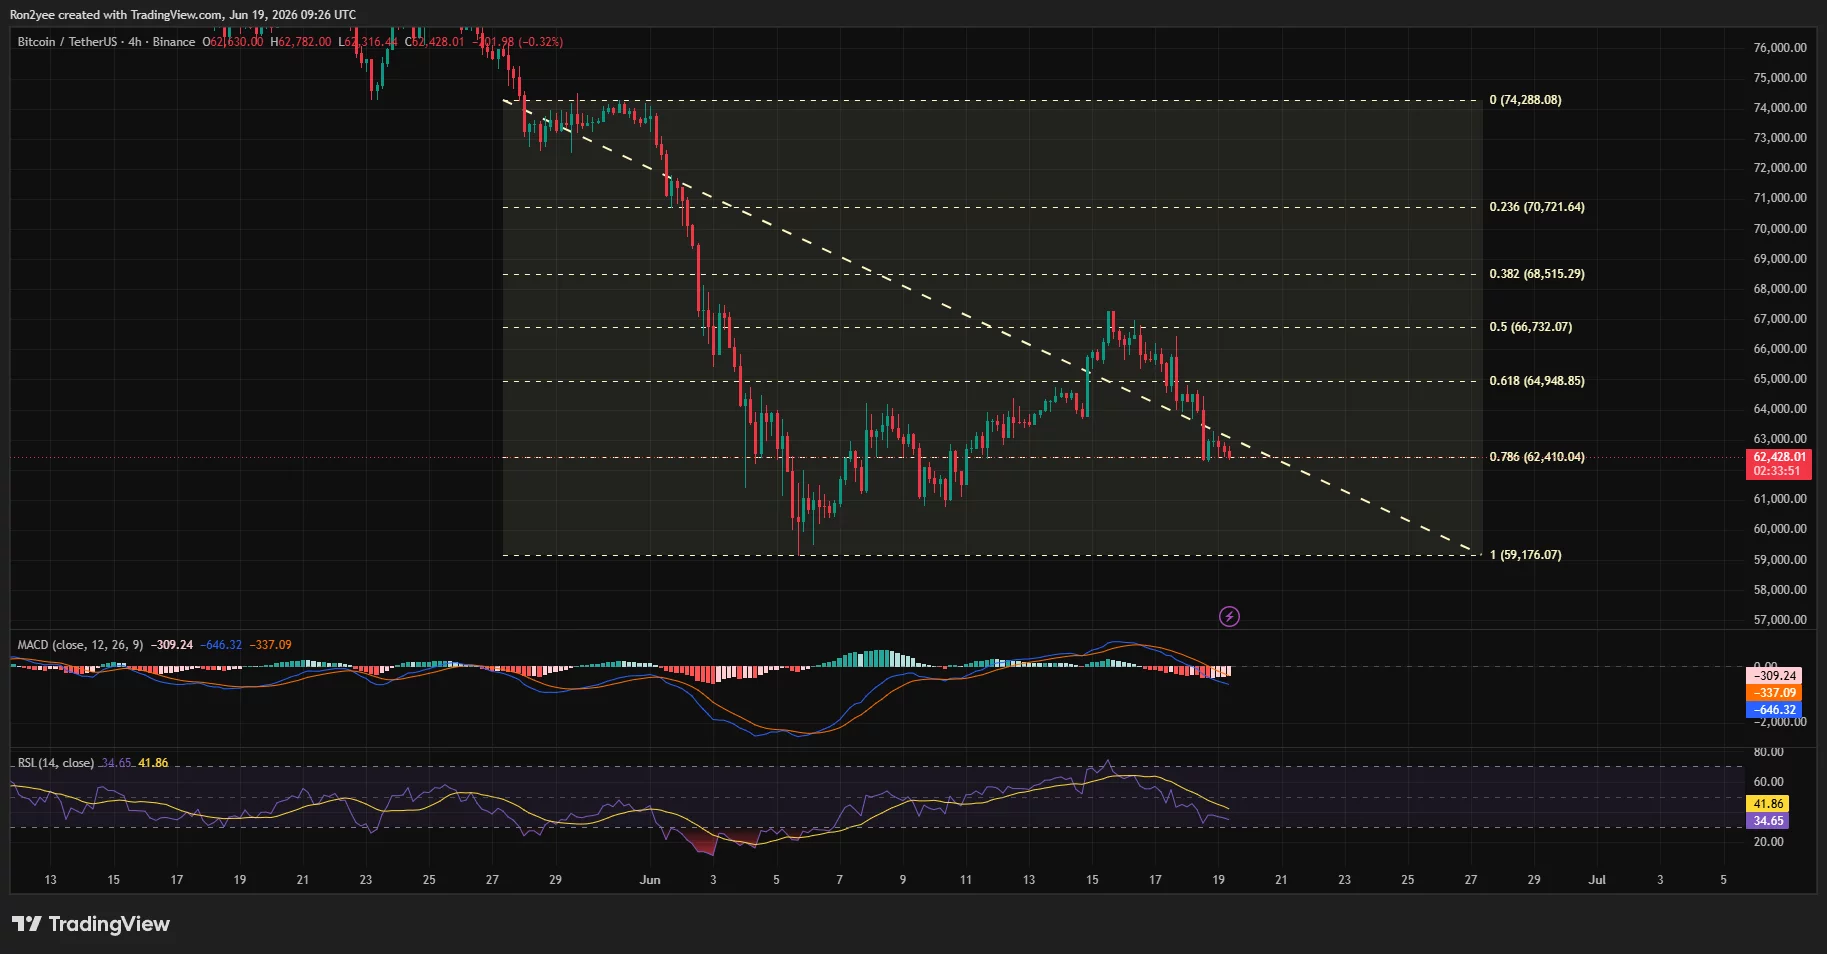
Momentum indicators remain weak. The four-hour RSI has dropped to roughly 35 while the MACD remains below its signal line with expanding negative histogram bars.
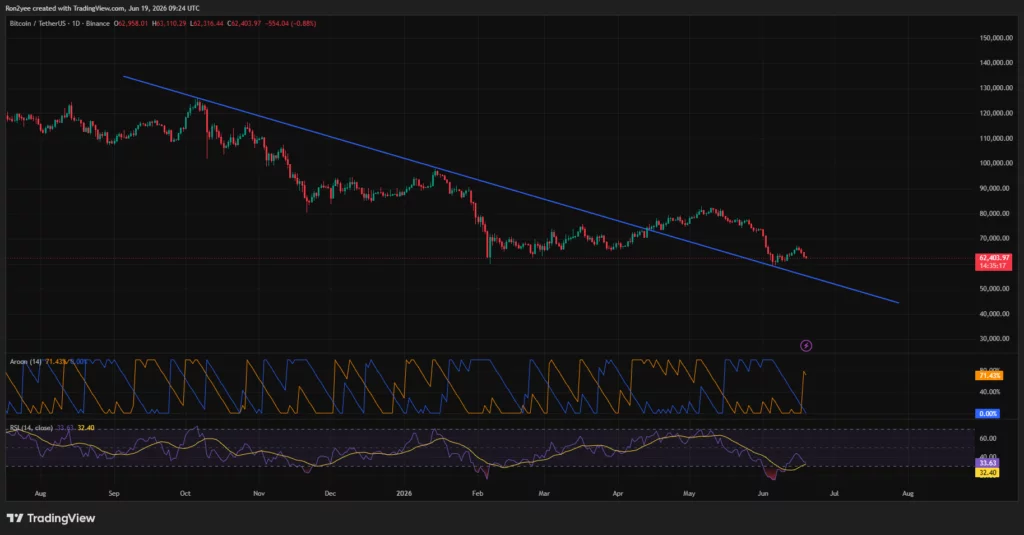
On the daily chart, Bitcoin continues to hold above a former descending resistance trendline that has now turned into support. Maintaining that structure remains important for bulls as the asset’s price approaches the $61,000-$62,000 support zone. The daily RSI sits near 34, while the Aroon indicator shows bearish dominance with the downtrend reading above 70 and the uptrend near zero.
Commenting on the setup, crypto analyst Daan Crypto Trades noted that Bitcoin is attempting to hold a major support region.
“Bulls need to hold that $61K-$62K region otherwise things get ugly real quick I think.”
Liquidity data highlights why that zone matters. CoinGlass heatmaps show dense liquidation clusters between $63,500 and $65,000, while another concentration of liquidity sits near $62,100. A recovery into the upper band could trigger short liquidations, whereas a move lower would expose fresh downside liquidity pockets.
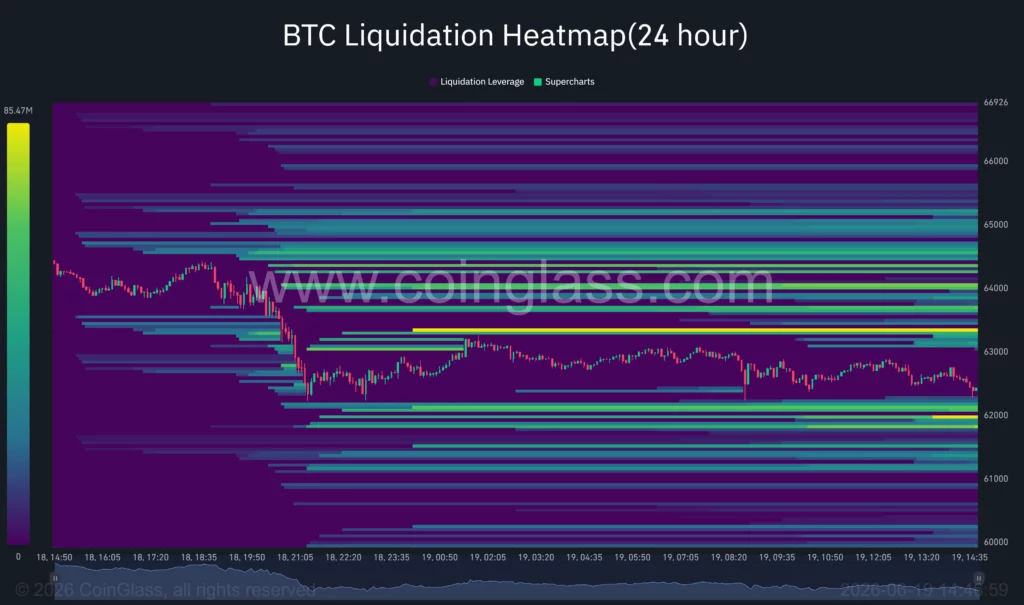
According to crypto analyst Lennaert Snyder, Bitcoin’s drop to roughly $62,300 fulfilled a key liquidity target. He noted that $60,500 represents the first area where a bounce could emerge, while a deeper move below $59,000 would provide a more attractive setup for a sustained reversal.
Failure to reclaim $65K could expose lower support zones
The primary risk for bulls remains Bitcoin’s inability to reclaim overhead resistance. The 61.8% Fibonacci retracement level sits near $64,950, while the midpoint of the recent range is located around $66,700. Those levels coincide with significant liquidation clusters identified on derivatives exchanges.
Another concern comes from institutional positioning. Recent ETF outflows and continued capital rotation toward technology and artificial-intelligence equities have reduced demand for Bitcoin during a period of heightened macro uncertainty.
Should BTC lose the $61,000-$62,000 support area, traders may shift attention toward the June low near $59,000. A decisive break below that level would strengthen the case for a deeper correction and place longer-term support zones in the mid-$40,000 region back into focus.
Disclosure: This article does not represent investment advice. The content and materials featured on this page are for educational purposes only.