

 Bitcoin
  Ethereum
  Tether
  BNB
BNB  XRP
XRP  USDC
USDC  Solana
  TRON
TRON  Figure Heloc
  Hyperliquid
  Dogecoin
  USDS
USDS  LEO Token
  Zcash
Zcash  Wrapped stETH
  Stellar
  Wrapped Bitcoin
  Cardano
  Binance Bridged USDT (BNB Smart Chain)
  WhiteBIT Coin
  Canton
  Wrapped eETH
  Ethena USDe
  Bitcoin Cash
  sUSDS
sUSDS  USD1
USD1  Coinbase Wrapped BTC
  MemeCore
  Hedera
  Litecoin
  WETH
WETH  Sui
Sui  NEAR Protocol
  Circle USYC
  USDT0
USDT0  LAB
LAB  Shiba Inu
  Avalanche
  Global Dollar
  Ethena Staked USDe
  Bittensor
  BlackRock USD Institutional Digital Liquidity Fund
  Ondo US Dollar Yield
  Worldcoin
  PAX Gold
  World Liberty Financial
  Ondo
Ondo  Aster
Aster  Polkadot
  Ripple USD
  syrupUSDC
  OKB
OKB  HTX DAO
  Falcon USD
  Pi Network
  USDD
USDD  Sky
Sky  BFUSD
BFUSD  Pepe
Pepe  Audiera
  Aave
Aave  Jupiter Perpetuals Liquidity Provider Token
  Quant
Quant  Cosmos Hub
  Jito Staked SOL
  KuCoin
  Spiko EU T-Bills Money Market Fund
  Render
  USDtb
USDtb  Binance-Peg WETH
  Rocket Pool ETH
  Janus Henderson Anemoy Treasury Fund
  Binance Bridged USDC (BNB Smart Chain)
  Algorand
  POL (ex-MATIC)
  Stable
  Function FBTC
  NEXO
NEXO  Ethena
  Venice Token
  Gate
Gate  Flare
Flare  syrupUSDT
  Janus Henderson Anemoy AAA CLO Fund
  JUST
JUST  币安人生 (BinanceLife)
  Binance Staked SOL
  Jupiter
  Filecoin
  Beldex
  Aptos
Aptos  NEW X CEO IS BACK
  Polygon Bridged USDC (Polygon PoS)
  Injective
  Solv Protocol BTC
  Midnight
  Pump.fun
  YLDS
YLDS  Usual USD
  clBTC
clBTC  Arbitrum
  A7A5
A7A5  Spiko Amundi Overnight Swap Fund (EUR)
  StakeWise Staked ETH
  Artificial Superintelligence Alliance
  TrueUSD
  Kinetiq Staked HYPE
  Ondo Short-Term U.S. Government Bond Fund
  tBTC
tBTC  Official Trump
  ADI
ADI  Pudgy Penguins
  VeChain
  Humanity
  c8ntinuum
  EURC
EURC  Mantle Staked Ether
  Bonk
Bonk  Lighter
  Polygon PoS Bridged DAI (Polygon POS)
  Virtuals Protocol
  Aerodrome Finance
  COCA
COCA  apxUSD
  Terra Luna Classic
  PRIME
PRIME  Liquid Staked ETH
  Jito
Jito  Arbitrum Bridged WBTC (Arbitrum One)
  Curve DAO
  SkyAI
SkyAI  Wrapped Flare
  The9bit
  L2 Standard Bridged WETH (Base)
  Celestia
  Steakhouse USDC Morpho Vault
  Kinesis Gold
  Sun Token
  SPX6900
  Pyth Network
  ETHGas
  Binance-Peg XRP
  Ether.fi
  Ether.Fi Liquid ETH
  USDGO
USDGO  Unibase
  Grass
Grass  Noon
Noon  LayerZero
  Zebec Network
  Monad
Monad  Jupiter Staked SOL
  Savings USDD
  Chiliz
  AINFT
AINFT  Marinade Staked SOL
  Kinesis Silver
  Arbitrum Bridged WETH (Arbitrum One)
Bitcoin has reclaimed the $66,000 level after remarks from U.S. President Donald Trump and reports of a tentative U.S.-Iran peace agreement revived risk appetite across global markets.
- Bitcoin climbed nearly 5% to $66,829 after Trump said oil ships were moving through the Strait of Hormuz and reports pointed to a tentative U.S.-Iran peace agreement.
- Oil prices fell 5.7% to a two-month low below $80, while spot Bitcoin ETFs recorded $85.9 million in inflows and Strategy added 1,587 BTC worth about $100 million.
- More than $168 million in Bitcoin short positions were liquidated as BTC broke above key resistance near $65,150 and reclaimed bullish momentum.
According to data from crypto.news, Bitcoin (BTC) climbed nearly 5% to an intraday high of roughly $66,829 on June 15 before settling near $66,460 at press time.
Bitcoin price rallied following comments from U.S. President Donald Trump, who wrote on Truth Social that ships carrying oil were once again moving through the Strait of Hormuz, a key route for global energy supplies.
“Ships are starting to move, many loaded up with Oil, out of the Strait of Hormuz. They are going along the Southern “Highway,” which is totally safe, secure, and pristine. There are other areas of travel, also!!!”
The comments arrived shortly after reports that the U.S. and Iran had reached a tentative peace agreement expected to reduce risks surrounding the strategic waterway.
Crude oil fell about 5.7% to below $80 per barrel, hitting its lowest level in two months and unwinding part of the geopolitical risk premium that had built up during recent weeks. The decline eased concerns about renewed inflationary pressure and helped improve appetite for risk assets after a difficult start to June.
Institutional flows also showed early signs of stabilization. U.S. spot Bitcoin ETFs attracted $85.9 million in net inflows after five consecutive days of withdrawals. Even so, the rebound remains limited in scope. According to SoSoValue data, the funds have recorded positive flows on just two trading days since May 15 and have collectively lost roughly $5.71 billion over the past five weeks.
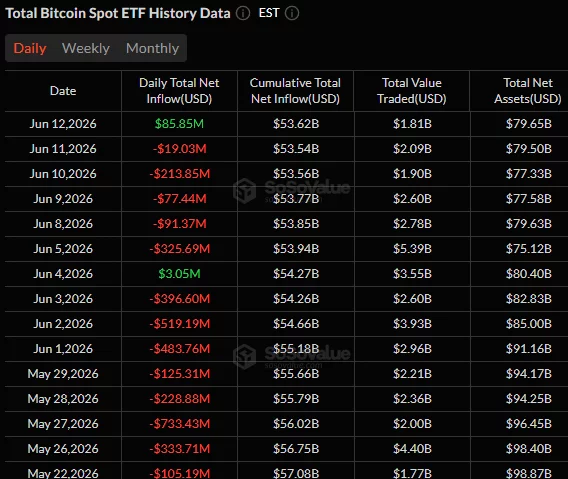
Alongside the return of ETF demand, corporate accumulation re-emerged as a source of support. As reported by crypto.news, Strategy disclosed the purchase of 1,587 BTC worth approximately $100 million, just two weeks after its first reported Bitcoin sale in years raised questions about whether the company’s long-standing accumulation strategy was changing.
The latest acquisition helped restore confidence among investors who viewed the earlier sale as a potential sign of weakening institutional conviction.
Bitcoin breaks above key resistance as short sellers unwind
On the daily chart, Bitcoin has reclaimed a major support-turned-resistance zone near $65,150 that had repeatedly acted as a pivot throughout March and April. Bitcoin price has now moved back above that level after briefly falling below $60,000 during last week’s sell-off.
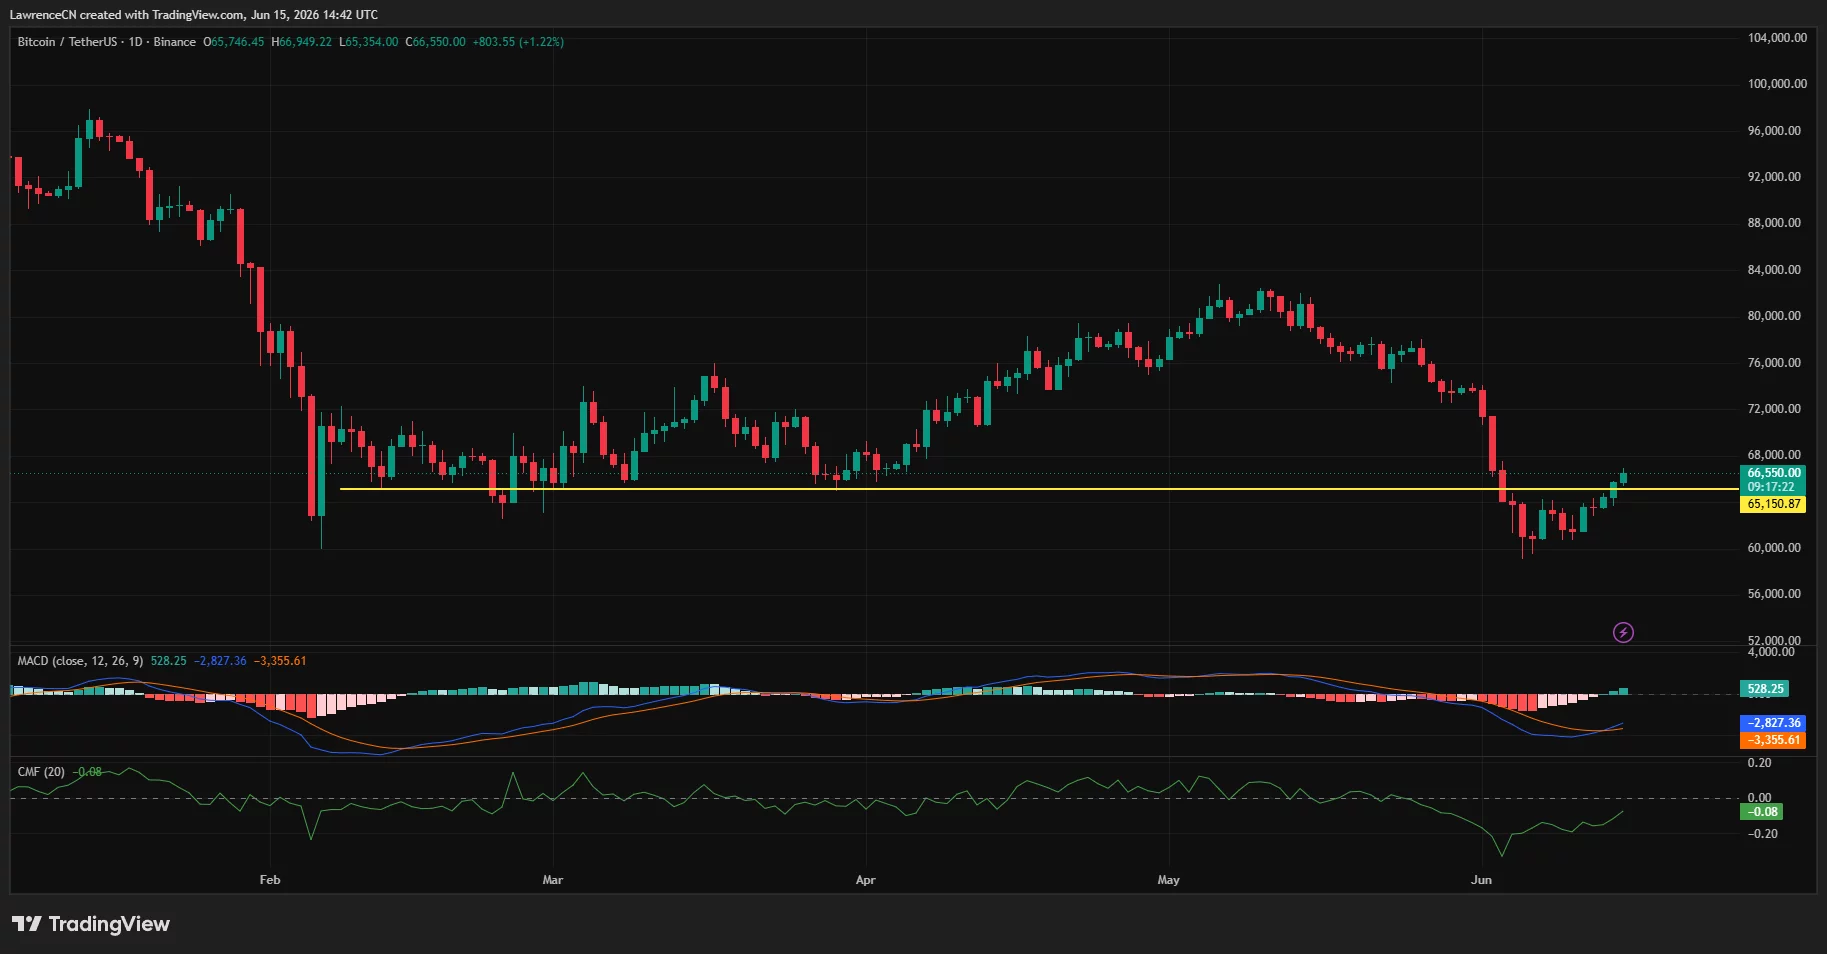
Momentum indicators have improved alongside the recovery. The daily MACD has produced a bullish crossover while its histogram has turned positive for the first time since the June decline began. Chaikin Money Flow has also recovered from deeply negative territory, suggesting capital is returning to the market after weeks of distribution.
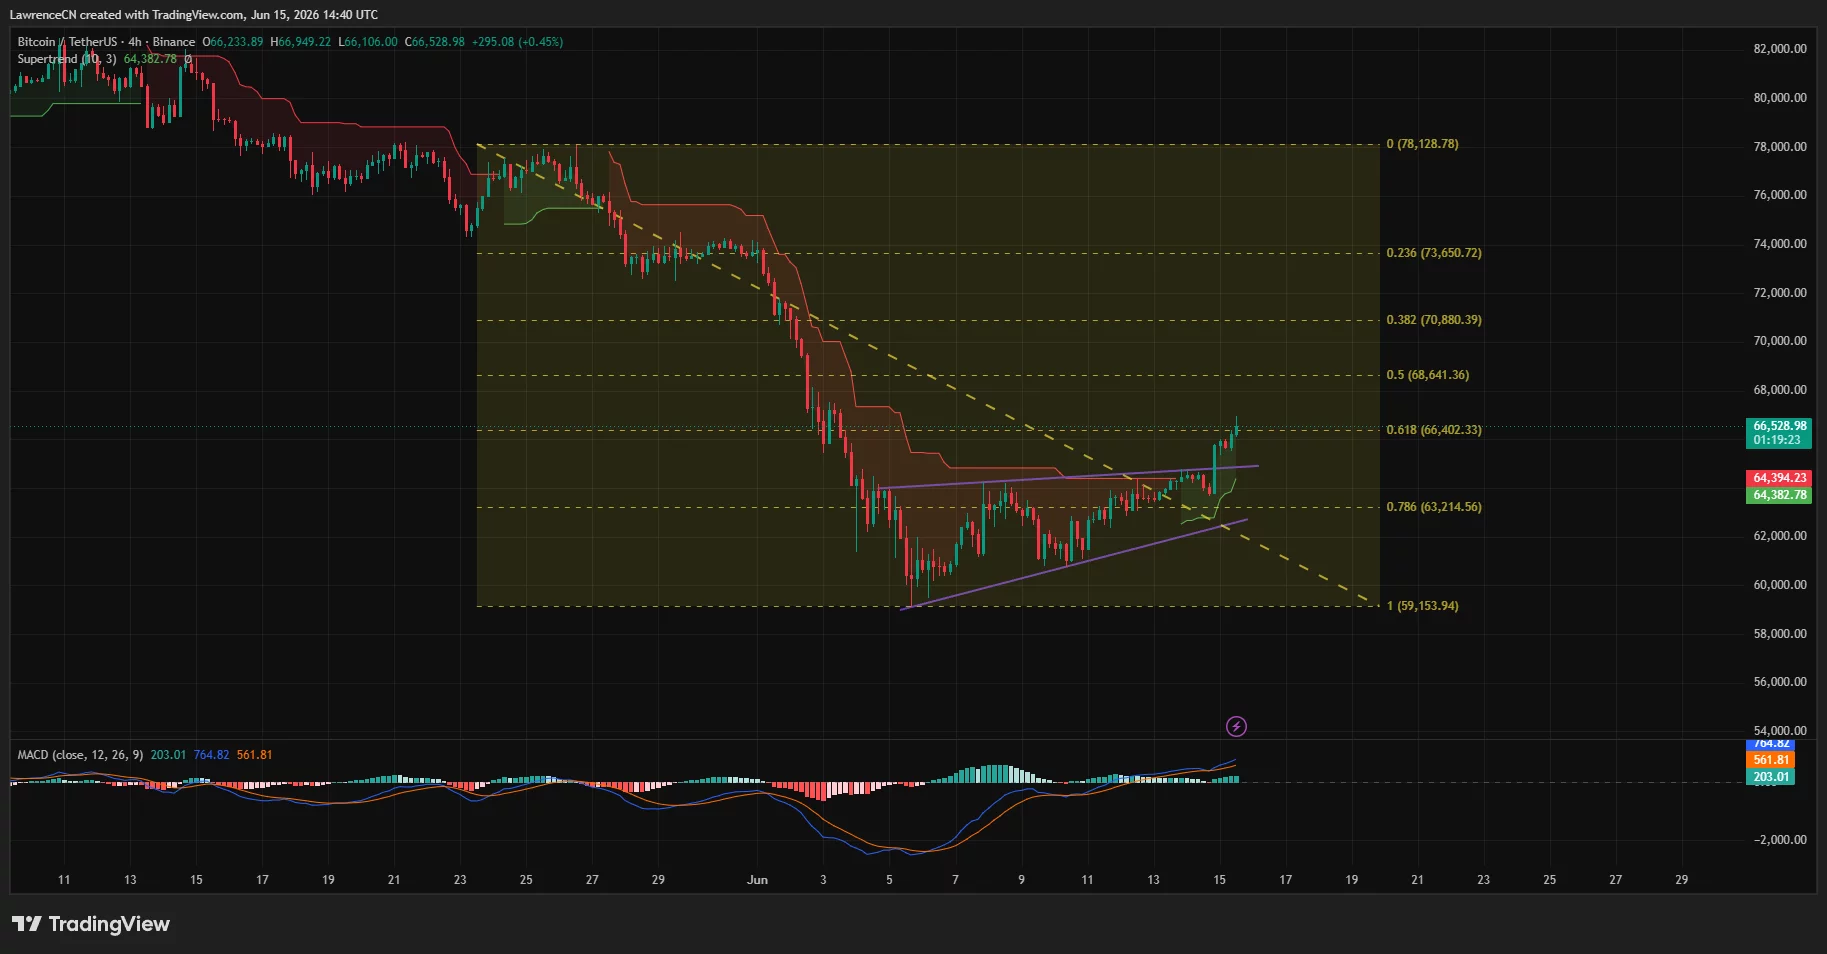
The four-hour chart shows Bitcoin breaking out from a descending trendline that had capped price action since late May. Bulls have also pushed the asset above the 61.8% Fibonacci retracement level near $66,402, placing the next resistance zone around $68,640, which aligns with the 50% retracement level. Beyond that, the $70,880 region represents another key hurdle.
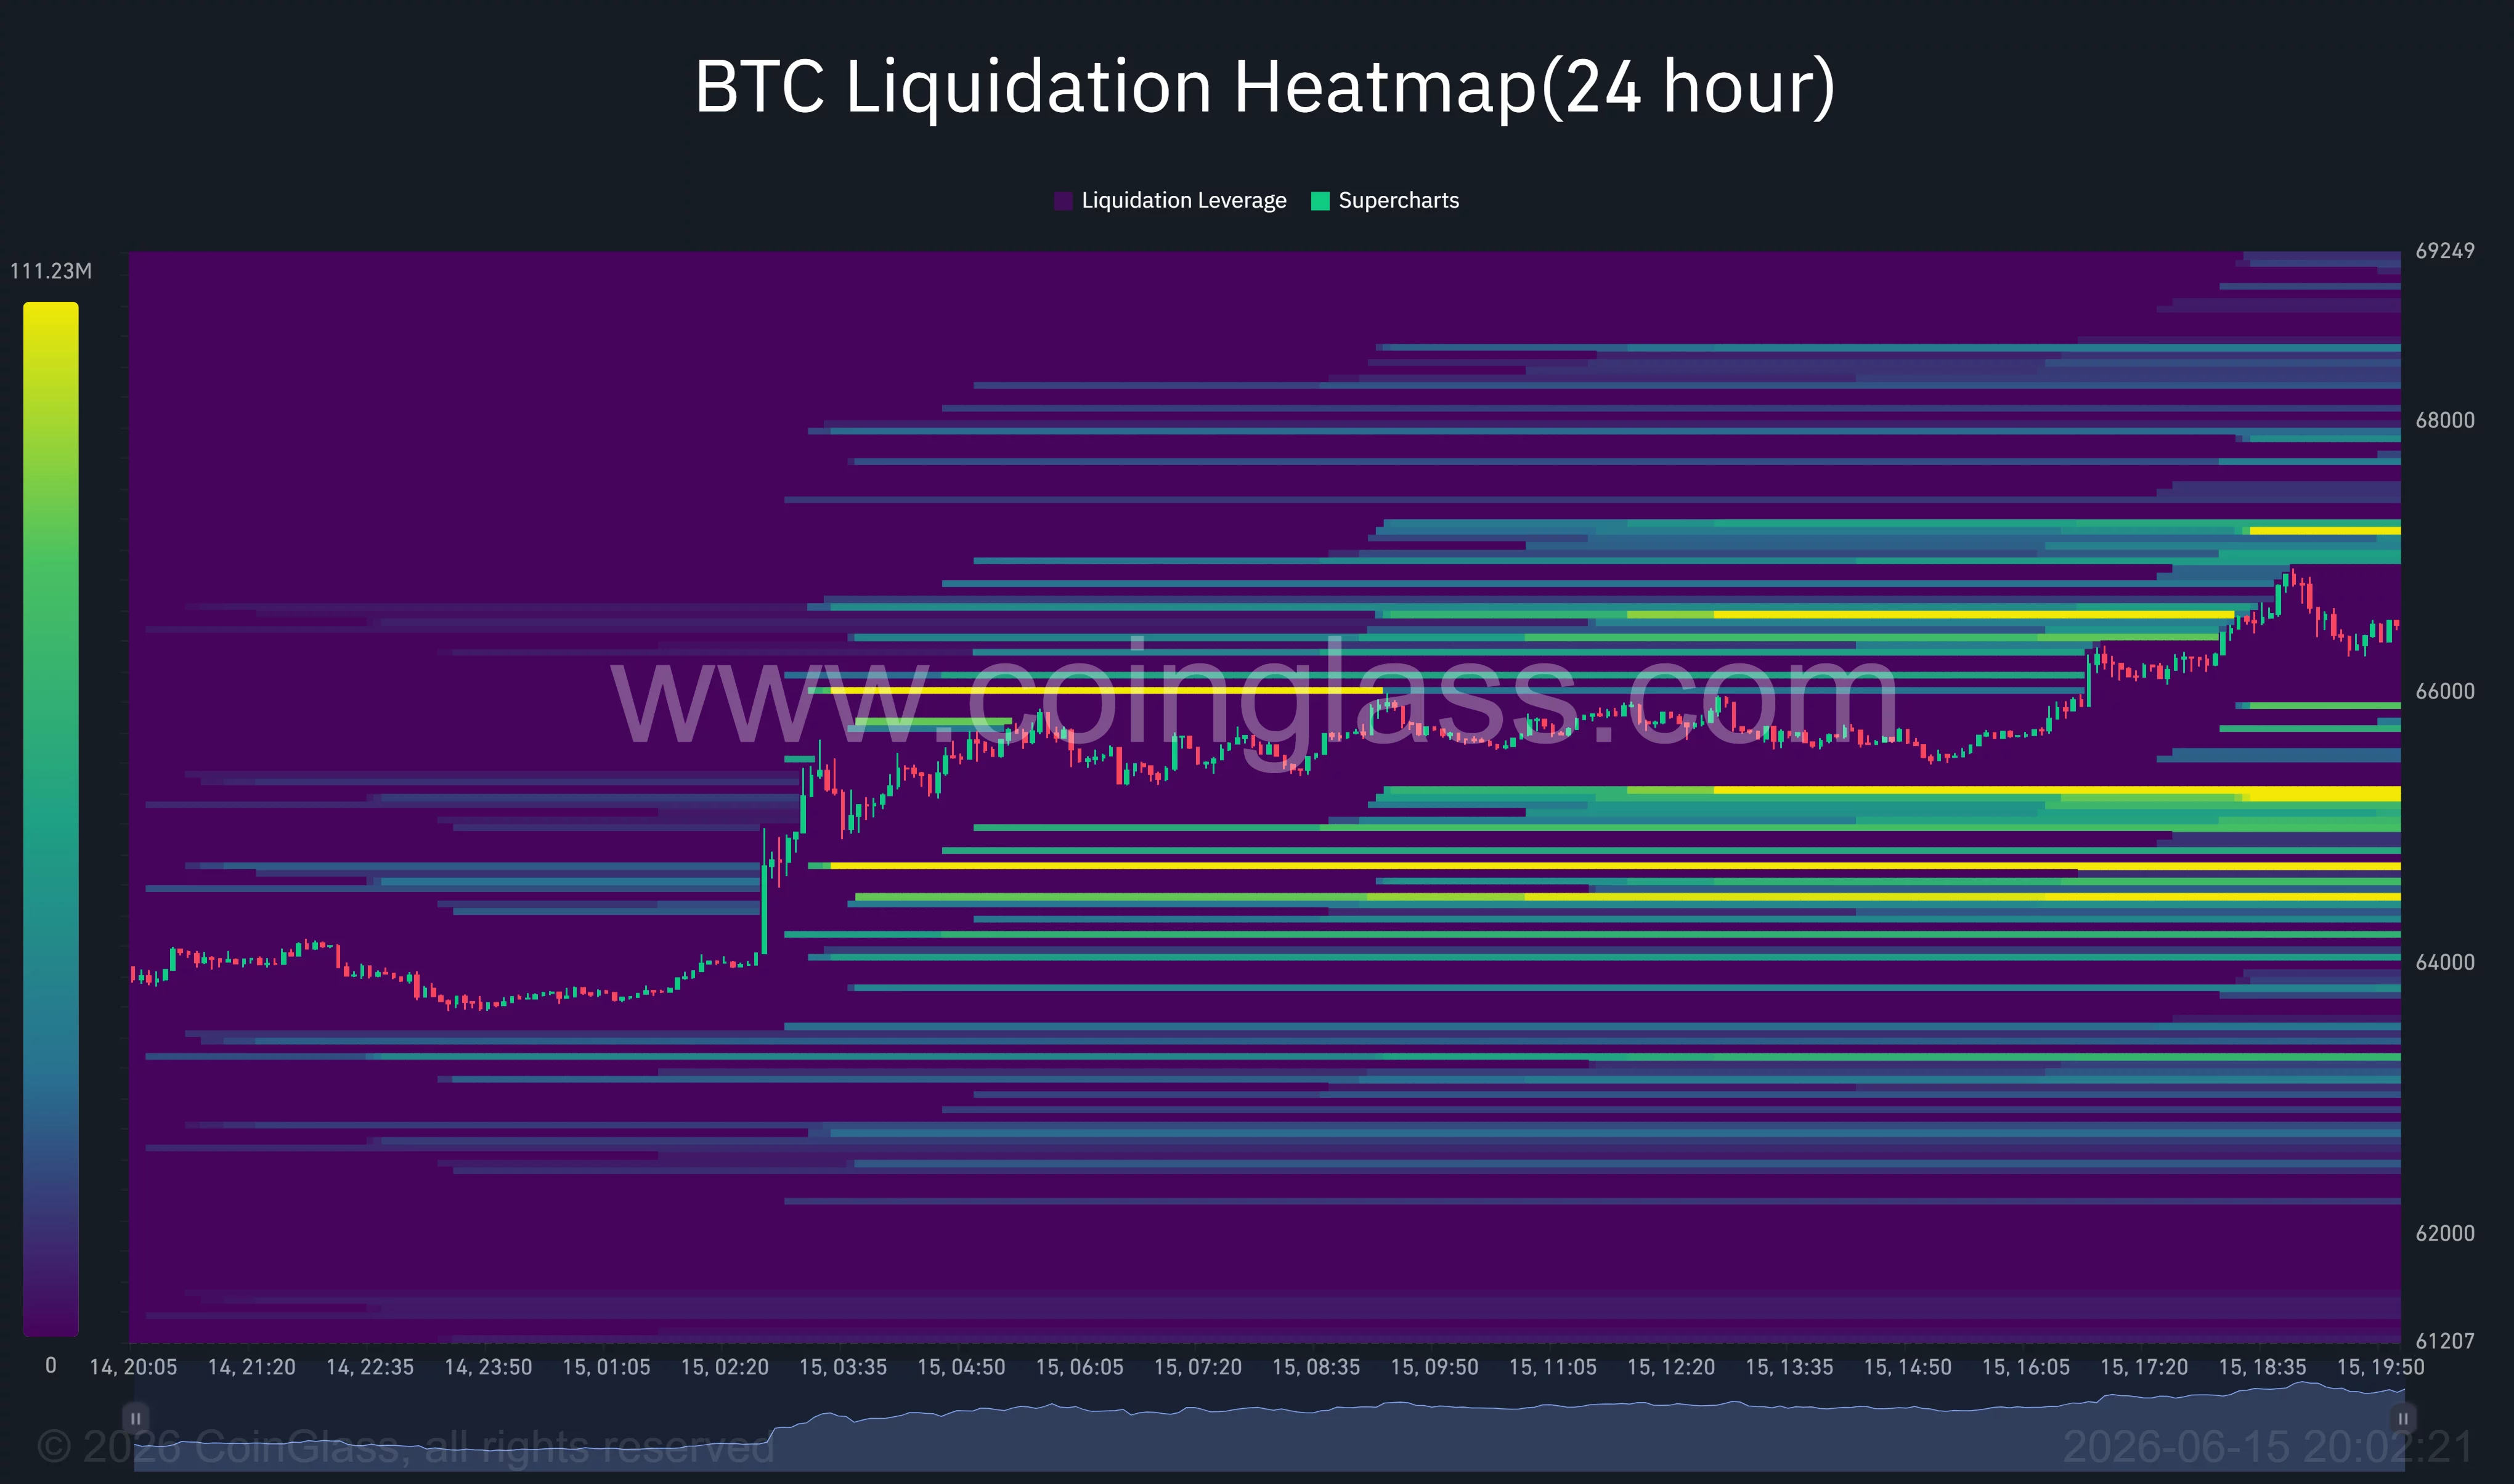
Derivatives activity accelerated the move. CoinGlass data showed more than $556.5 million in crypto liquidations over the past 24 hours, including roughly $459.9 million from short positions.
Bitcoin alone accounted for approximately $168.7 million in short liquidations compared with about $23 million from longs, highlighting the scale of the squeeze as traders rushed to cover bearish bets.
Liquidation heatmaps also show dense clusters of leverage concentrated between $67,000 and $68,000. Those zones could act as magnets for price if momentum continues, while substantial liquidity remains below the market around the $64,500-$65,000 area.
On-chain data suggests buyers have returned after Bitcoin’s correction to the $60,000 region. According to Glassnode, accumulation trend scores have increased across multiple wallet cohorts following the recent decline. The firm noted that supply is being absorbed after the move lower, a development that historically accompanies periods of renewed demand.
Options positioning presents another supportive factor. Glassnode observed that Bitcoin has moved back into a dense cluster of options exposure around the $65,000 strike, where dealer hedging flows may help stabilize price action after recent volatility.
Fed uncertainty and $65K support remain critical
Not all analysts view the move as a confirmed trend reversal. Commenting on the rally, crypto analyst Ted Pillows argued that recent price action looked more like a liquidity grab than a decisive breakout.
“If $BTC can maintain strength above $65,000, a move toward the $68,000-$70,000 range is possible.”
Despite the bullish price action, Pillows said the overall market trend remains bearish until further confirmation appears.
A different view came from crypto analyst Scott Melker, who pointed to Bitcoin’s repeated defense of its 200-week moving average and a bullish divergence on the weekly RSI. Melker noted that similar conditions have historically appeared near major market bottoms.
Attention now turns to next week’s Federal Reserve meeting on June 16-17. Any indication from policymakers that inflation remains a concern despite the recent decline in oil prices could weigh on risk assets and challenge Bitcoin’s recovery.
From a technical standpoint, a sustained move back below $65,000 would weaken the recent breakout and place the $63,200-$64,000 support region back into focus.
From a technical perspective, a move back below $65,000 would place the reclaimed support zone at risk and expose Bitcoin to another test of the $63,200-$64,000 area, where the recent breakout structure would begin to weaken.
Disclosure: This article does not represent investment advice. The content and materials featured on this page are for educational purposes only.