

 Bitcoin
  Ethereum
  Tether
  BNB
BNB  XRP
XRP  USDC
USDC  Solana
  TRON
TRON  Figure Heloc
  Hyperliquid
  Dogecoin
  USDS
USDS  LEO Token
  Zcash
Zcash  Wrapped stETH
  Stellar
  Wrapped Bitcoin
  Cardano
  Binance Bridged USDT (BNB Smart Chain)
  WhiteBIT Coin
  Canton
  Wrapped eETH
  Bitcoin Cash
  Ethena USDe
  sUSDS
sUSDS  USD1
USD1  Coinbase Wrapped BTC
  MemeCore
  Hedera
  Litecoin
  WETH
WETH  Sui
Sui  NEAR Protocol
  LAB
LAB  USDT0
USDT0  Shiba Inu
  Circle USYC
  Avalanche
  Global Dollar
  Ethena Staked USDe
  Bittensor
  BlackRock USD Institutional Digital Liquidity Fund
  Ondo US Dollar Yield
  Worldcoin
  PAX Gold
  World Liberty Financial
  Ondo
Ondo  Polkadot
  Aster
Aster  Ripple USD
  syrupUSDC
  OKB
OKB  HTX DAO
  Pi Network
  Falcon USD
  USDD
USDD  Sky
Sky  BFUSD
BFUSD  Pepe
Pepe  Audiera
  Aave
Aave  Jupiter Perpetuals Liquidity Provider Token
  Quant
Quant  Cosmos Hub
  KuCoin
  Jito Staked SOL
  Render
  Spiko EU T-Bills Money Market Fund
  USDtb
USDtb  Binance-Peg WETH
  Rocket Pool ETH
  Janus Henderson Anemoy Treasury Fund
  Binance Bridged USDC (BNB Smart Chain)
  Algorand
  Stable
  POL (ex-MATIC)
  Function FBTC
  NEXO
NEXO  Ethena
  Venice Token
  Gate
Gate  币安人生 (BinanceLife)
  syrupUSDT
  Flare
Flare  Janus Henderson Anemoy AAA CLO Fund
  JUST
JUST  Binance Staked SOL
  Filecoin
  Jupiter
  Beldex
  Aptos
Aptos  NEW X CEO IS BACK
  Polygon Bridged USDC (Polygon PoS)
  Midnight
  Solv Protocol BTC
  Pump.fun
  Arbitrum
  YLDS
YLDS  Humanity
  clBTC
clBTC  Usual USD
  Injective
  A7A5
A7A5  Spiko Amundi Overnight Swap Fund (EUR)
  StakeWise Staked ETH
  Artificial Superintelligence Alliance
  Kinetiq Staked HYPE
  TrueUSD
  tBTC
tBTC  Ondo Short-Term U.S. Government Bond Fund
  Official Trump
  ADI
ADI  VeChain
  Pudgy Penguins
  c8ntinuum
  EURC
EURC  Mantle Staked Ether
  Bonk
Bonk  Virtuals Protocol
  Polygon PoS Bridged DAI (Polygon POS)
  Lighter
  Terra Luna Classic
  COCA
COCA  Aerodrome Finance
  apxUSD
  PRIME
PRIME  Liquid Staked ETH
  Arbitrum Bridged WBTC (Arbitrum One)
  Curve DAO
  The9bit
  Wrapped Flare
  SkyAI
SkyAI  Celestia
  L2 Standard Bridged WETH (Base)
  Kinesis Gold
  Steakhouse USDC Morpho Vault
  Sun Token
  SPX6900
  Pyth Network
  Jito
Jito  ETHGas
  Binance-Peg XRP
  Ether.fi
  Ether.Fi Liquid ETH
  USDGO
USDGO  Unibase
  LayerZero
  Grass
Grass  Noon
Noon  Zebec Network
  Monad
Monad  Jupiter Staked SOL
  Kinesis Silver
  Savings USDD
  Chiliz
  Marinade Staked SOL
  AINFT
AINFT  Arbitrum Bridged WETH (Arbitrum One)
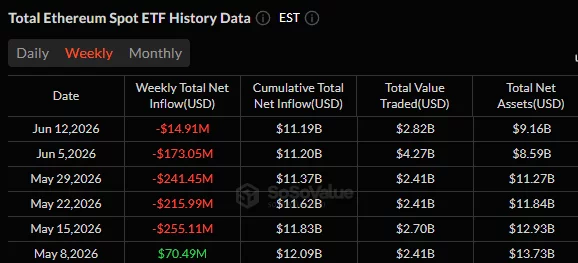
Ethereum has rebounded above $1,700 as easing geopolitical tensions and renewed whale accumulation raise hopes that the second-largest cryptocurrency could break out of its multi-week bearish structure.
- Ethereum climbed nearly 4% above $1,720 as easing geopolitical tensions and whale accumulation boosted market sentiment.
- A breakout from a symmetrical triangle and improving momentum indicators have placed the $1,850-$1,900 resistance zone in focus.
- Persistent ETF outflows and weakening Ethereum tokenomics remain key risks despite the recent recovery.
According to data from crypto.news, Ethereum (ETH) climbed nearly 4% on June 15 to trade above $1,720 as oil prices retreated following the reopening of the Strait of Hormuz, reducing immediate inflation concerns that had weighed on risk assets. The rebound comes after weeks of sustained selling pressure that dragged ETH from above $2,000 earlier this month to a local low near $1,510.
Ethereum’s rebound today came alongside Bitcoin’s roughly 3% gain and a rebound in technology stocks, helping Ethereum recover from last week’s sell-off and reclaim a key psychological level.
ETH also benefited from renewed whale accumulation. According to Lookonchain, a whale wallet purchased another 5,818 ETH worth roughly $10 million, extending a series of recent buying transactions.
However, not all market participants have shared the renewed optimism. SosoValue data shows spot Ethereum ETFs have now recorded five consecutive weeks of net outflows, with nearly $900 million leaving the funds during that period. The persistent withdrawals suggest many institutional investors remain cautious despite the recent recovery.

Additional commentary from market participants suggests selling pressure may be easing. According to Whale Factor, “the market is running out of active sellers,” noting that outflows from Bitcoin and Ethereum investment products fell sharply compared with the previous week.
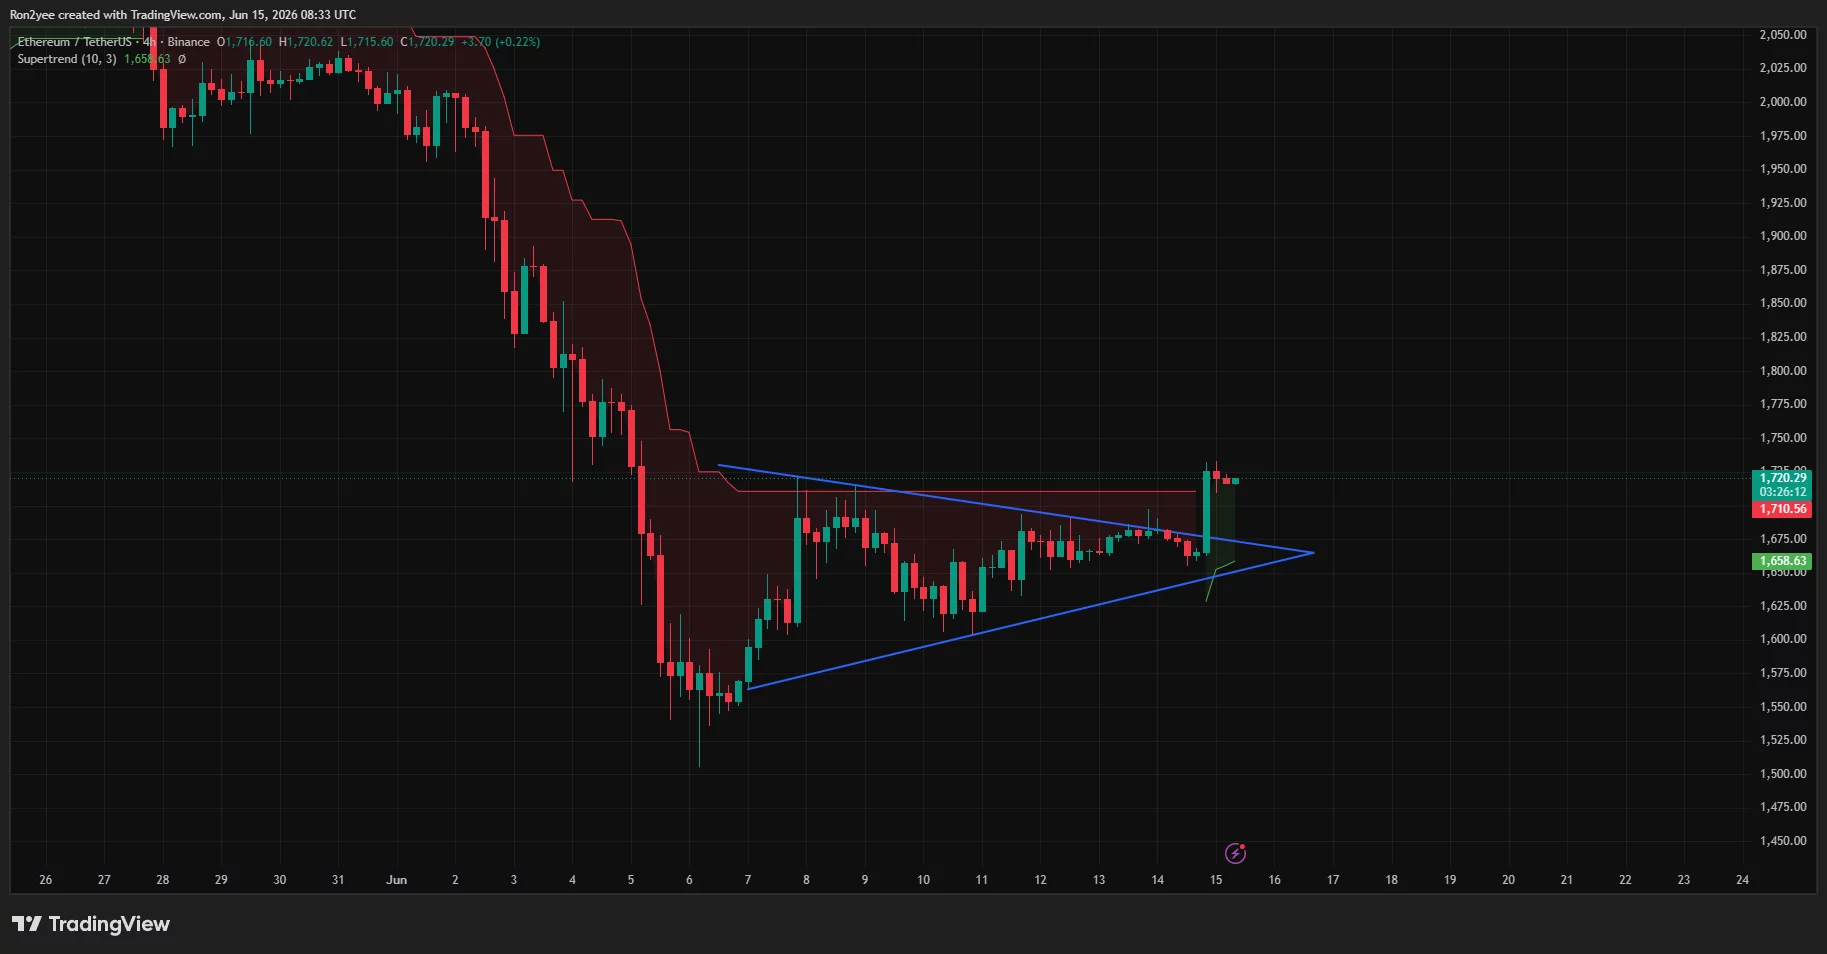
Ethereum has broken above short-term resistance
On the four-hour chart, Ethereum has broken out of a symmetrical triangle that had been forming since the June 6 low near $1,510. The breakout pushed price above the triangle’s upper trendline and back above the $1,700 region, while the Supertrend indicator flipped bullish with support near $1,658.
Momentum indicators have also improved. On the daily chart, the RSI has recovered from deeply oversold territory and climbed toward 37, while the MACD histogram has turned positive for the first time in several sessions. ETH price has also reclaimed the 0.786 Fibonacci retracement level near $1,707, measured from the June decline between $2,426 and $1,511.
Despite the short-term breakout, the daily chart shows Ethereum still trading within a larger bearish flag that formed after the early June decline. ETH price is currently testing the pattern’s upper boundary near the $1,750-$1,800 region, an area that could determine whether the recent recovery develops into a broader trend reversal.
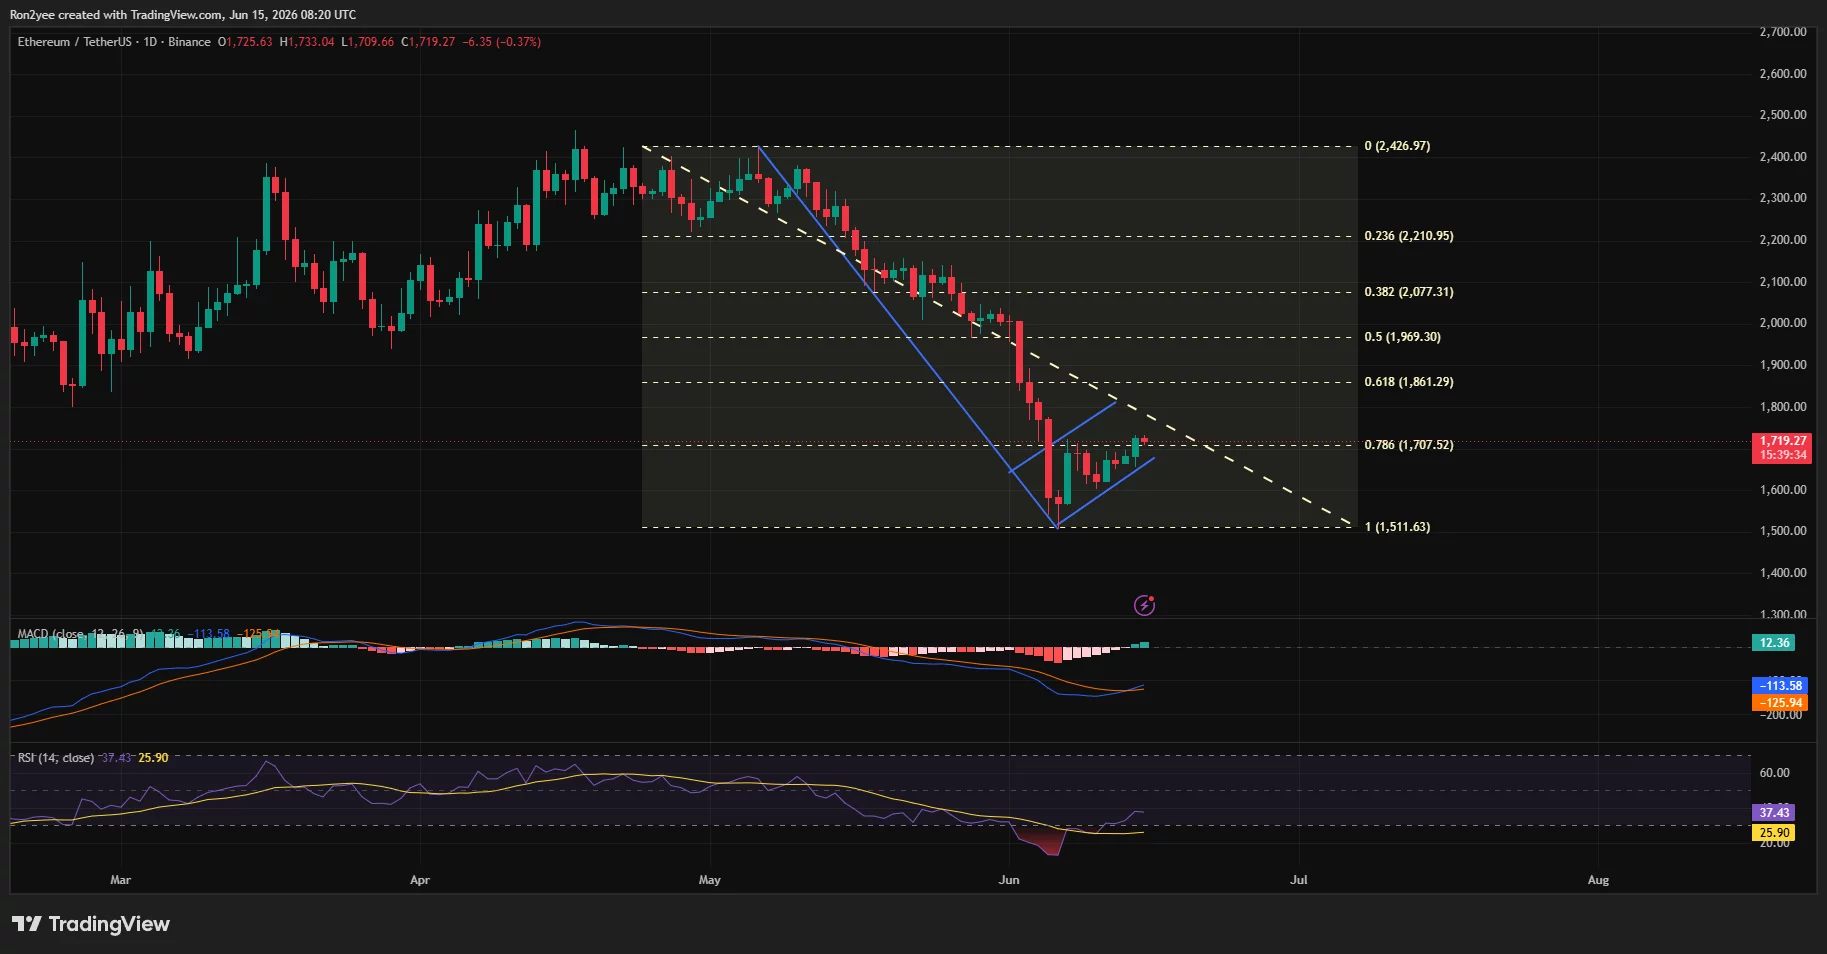
A decisive move above that level could invalidate the bearish setup and open the door toward the $1,850-$1,900 area, while rejection would keep the flag structure intact and raise the risk of another leg lower.
Commenting on the current ETH setup, crypto analyst Ted Pillows argued that Ethereum has already broken its short-term downtrend.
“$ETH has broken out of its short-term downtrend. If Ethereum breaks above the $1,700 level, it could rally towards the $1,850-$1,900 level.”
The next major technical hurdle sits around $1,860, which aligns with the 0.618 Fibonacci retracement level. A successful move through that area would place the psychological $1,900 level back into focus and potentially challenge the descending trendline that has capped rallies since May.
Derivatives markets also show traders re-entering bullish positions. Funding rates have returned to positive territory after spending much of the recent decline below neutral levels, suggesting leveraged traders are once again paying to maintain long exposure.
Liquidation clusters create both upside targets and downside risks
CoinGlass liquidation data reveals a dense concentration of short liquidations between $1,740 and $1,760, with another sizeable cluster extending toward $1,790. A push into those levels could force additional short covering and accelerate price movement higher.
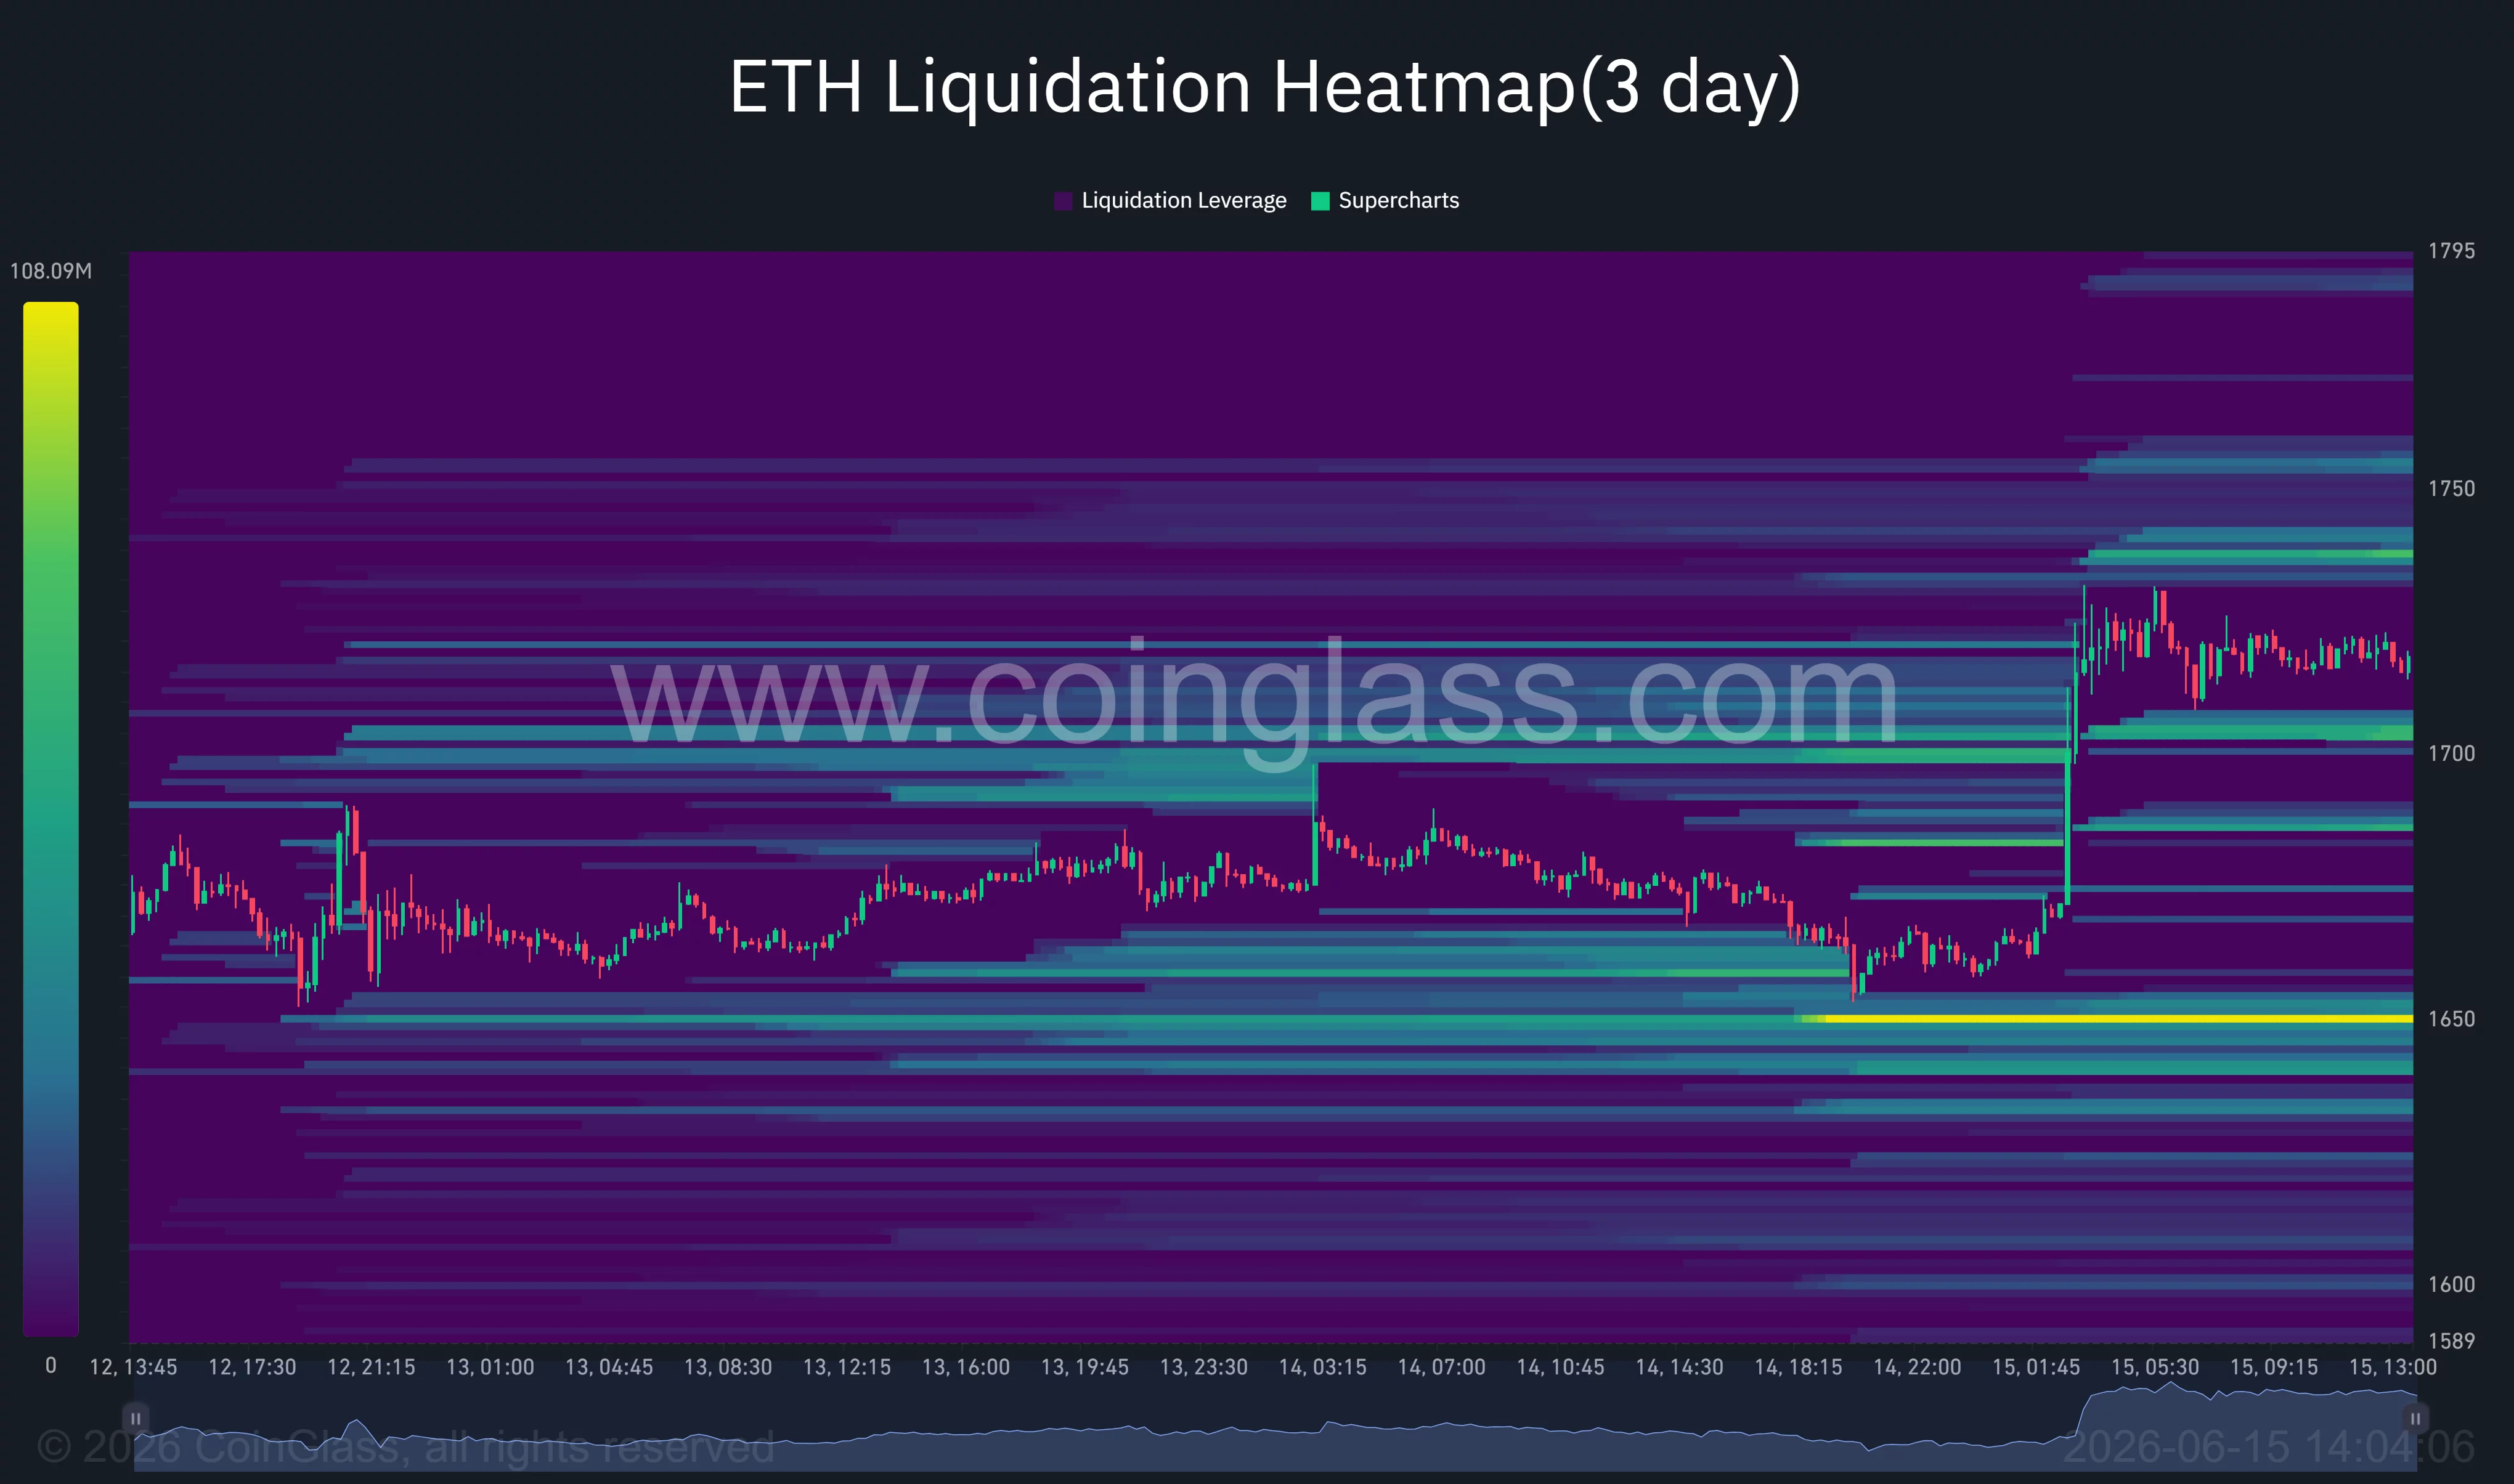
Below the market, the largest liquidity pocket remains near $1,650. The heatmap shows a substantial concentration of leveraged positions at that level, making it an important support zone for bulls.
Loss of that area could expose Ethereum to another sweep toward the whale liquidation region around $1,420.
Fundamental risks also remain unresolved. Ethereum continues to face pressure from weakening token burn dynamics as Layer-2 networks capture transaction activity while generating fewer fees for the main chain.
At the same time, ETF outflows and capital rotation into artificial intelligence equities have limited demand for large-cap altcoins throughout 2026.
While Ethereum has secured a technical breakout and attracted fresh whale buying, a full recovery will likely depend on bulls defending the $1,650-$1,700 range and breaking through the heavy resistance cluster between $1,850 and $1,900.
Disclosure: This article does not represent investment advice. The content and materials featured on this page are for educational purposes only.